Bear Put Spread Explained – Guide With Visuals

Bear Put Spread

The purchase of a put spread (a “long put spread” or “bear put spread” position) is a bearish options strategy that consists of simultaneously buying a put option and selling the same number of put options at a lower strike price on a stock that a trader believes will decrease in price.

Both options must be in the same expiration cycle.

The strategy builds on a long put position by selling a put at a lower strike price to reduce the cost, and therefore the risk of the trade.

Jump To

TAKEAWAYS

  • The bear put spread is a bearish strategy with defined risk.

  • The inputs of a bear put spread are one long put (higher) strike price and one short put (lower strike price).

  • This strategy has “defined risk”; maximum loss is the debit paid. 

  • The long put spread maximum profit is the difference between the strike prices, minus the net debit paid.

Bear Put Spread Strategy Characteristics

Here are the strategy’s general characteristics:

➟Maximum Profit Potential: (Width of Put Strikes – Net Debit Paid) x 100

➟Maximum Loss Potential: Net Debit Paid x 100

➟Expiration Breakeven Price: Long Put Strike Price – Net Debit Paid

To better understand each of these characteristics, we’re going to look at a basic example.

Options Trading for Beginners(2)(1)

New to options trading? Learn the essential concepts of options trading with our FREE 160+ page Options Trading for Beginners PDF.

Profit/Loss Potential at Expiration

In the following example, we’ll construct a bear put spread from two of the put options in the following options chain:

bear put chain

In order to construct a bear put spread, we’ll have to buy a put while also selling a put at a lower strike price. 

In this example, we’ll buy the 130 put for $5.00 and sell the 120 put for $2.00.

Let’s also say that the stock price is trading for $135 at the time of buying the spread:

Initial Stock Price: $135

Put Options Traded: Buy 130 put for $5.00; Sell 120 put for $2.00

Put Spread Purchase Price: $5.00 Paid – $2.00 Received = $3.00 Net Debit

If a trader buys this put spread, their potential profits and losses at expiration are described by the following visual:

Long Put Spread Outcomes

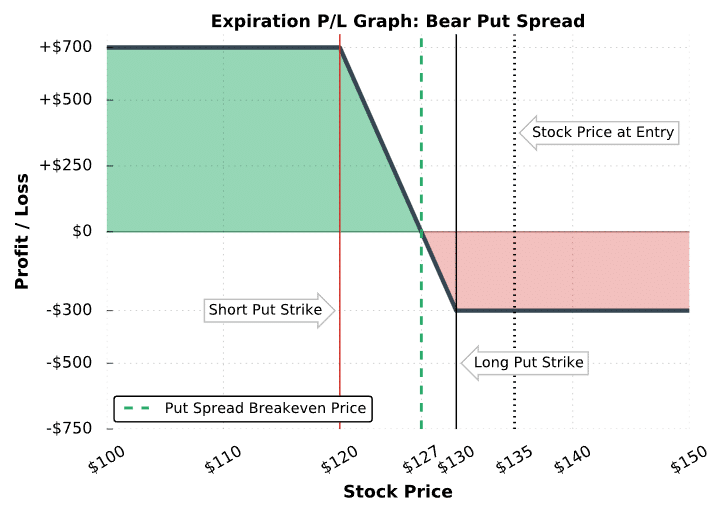
This particular put spread is out-of-the-money because the 130 and 120 puts are both out-of-the-money. As a result, the put spread has a probability of profit less than 50% because the stock price must fall below 130 for the position to have any value at expiration.

Additionally, the maximum profit potential is $700, and the maximum loss potential is $300, which also suggests a lower probability of profit because the reward is greater than the risk.

The following table describes various scenarios of this bear put spread position at expiration:

Stock Price At or Below the Short Put Strike Price (At or Below $120):

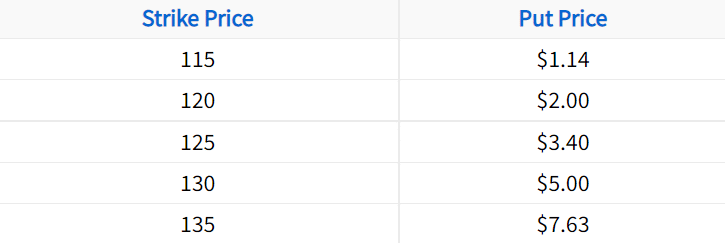
Both options of the put spread are fully in-the-money, and since the put strikes are $10 apart, the spread is worth its maximum value of $10 at expiration. With an initial purchase price of $3.00, the put spread buyer realizes the maximum profit potential of $700: ($10 spread price at expiration – $3 spread purchase price) x 100 = +$700.

Stock Price Between the Short Put Strike Price ($120) and the Breakeven Price ($127):

The long 130 put expires with more intrinsic value than the $3.00 purchase price of the spread. Because of this, the put spread buyer is profitable at expiration.

Stock Price At the Breakeven Price ($127):

The long 130 put is worth exactly $3.00 at expiration, and the 120 put expires worthless. As a result, the 130/120 put spread’s final value is $3.00. Since the spread was initially bought for $3.00, the trader realizes no profits or losses.

Stock Price Between the Breakeven Price ($127) and the Long Put Strike Price ($130):

The short 120 put expires worthless, and the long 130 put expires with less than $3.00 of intrinsic value. As a result, the 130/120 put spread’s final value is less than $3.00, which results in losses for the buyer of the put spread.

Stock Price At or Above the Long Put Strike Price ($130):

Both the 130 and 120 put expire worthless, resulting in a $200 profit on the short 120 put, and a $500 loss on the long 130 put. The net loss is $300, which is the maximum loss potential of a spread purchased for $3.00.

Nice job! You know the basics of the bear put spread strategy.

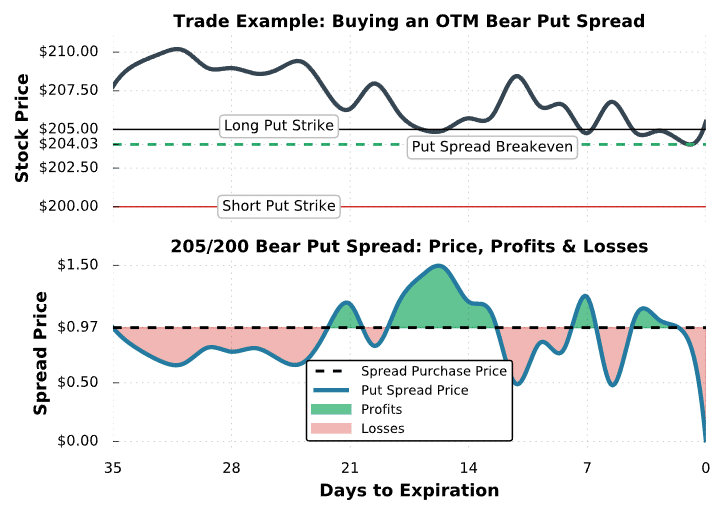
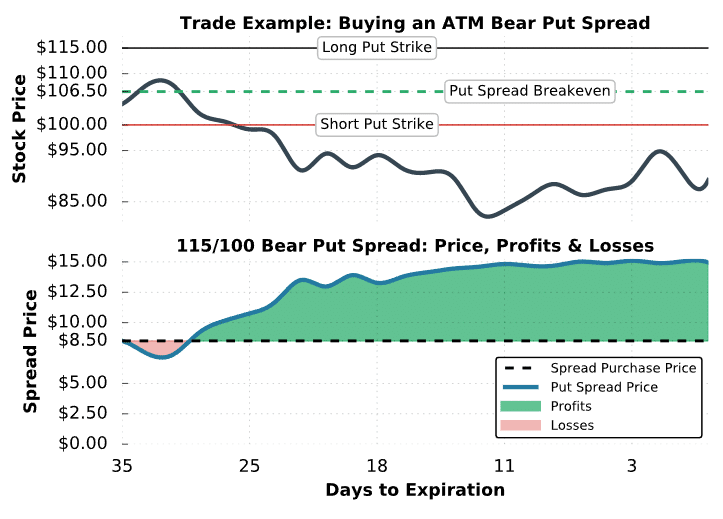
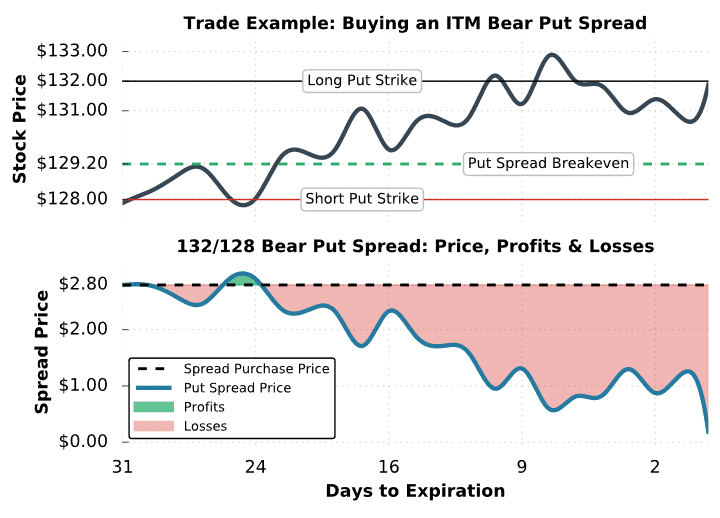
In the next section, we’ll look at real trade examples to show you how the strategy has performed over time in different scenarios.

Bear Put Spread Trade Examples

To visualize the performance of various long put spread positions, let’s look at a few real examples. Before we start, it’s important to note that we won’t specify the stock the trade was on, as the concepts in each case are transferable to put spreads on other stocks in the market.

Additionally, each example uses a size of one put spread. To convert the profits and losses to a larger position, just multiply the profits and losses by the number of spreads.

Trade Example #1: Low Probability Put Spread Purchase

The first example we’ll look at is a scenario where a hypothetical trader buys an out-of-the-money put spread and the stock price gradually decreases.

Here are the trade details:

Initial Stock Price: $207.78

Put Strikes and Expiration: Long 205 Put for $2.10; Short 200 Put for $1.13; Both options expiring in 35 days

Put Spread Purchase Price: $2.10 Paid – $1.13 Received = $0.97 Net Debit/Price Paid

Breakeven Price: $205 Long Put Strike – $0.97 Net Debit = $204.03

Maximum Profit Potential: ($5-Wide Strikes – $0.97 Net Debit) x 100 = $403

Maximum Loss Potential: $0.97 Net Debit x 100 = $97

In this example, the put spread is entirely out-of-the-money when entering the trade. Additionally, the maximum profit potential is $403, while the maximum loss potential is $97. Because of the high reward and low risk, the put spread’s probability of profit is much lower than 50%.

Let’s see how this trade performed:

Long Put Spread #1 Trade Results

As we can see here, the put spread’s value increased as the stock price fell. At around 16 days to expiration, the put spread was trading for $1.50, resulting in an unrealized profit of $53 for the long put spread trader: ($1.50 spread price – $0.97 purchase price) x 100 = +$53If the trader wanted to take their profits, they could have sold the spread when it was trading for $1.50. Of course, they wouldn’t know that would be the moment of maximum profitability, but the key here is that all option positions can be closed before expiration, in which the profit/loss at that moment will be realized.

If the trader decided to hold the spread until expiration, they would have realized the maximum loss of $97, as the stock price was above both put strikes at expiration. 

This example demonstrates that buying out-of-the-money put spreads requires a significant decrease in the stock price to have profits at expiration.

Additionally, even when the stock price falls, the long put spread trader may still lose money due to time decay if the move doesn’t happen quickly. 

When the put spread is out-of-the-money, its value will approach $0 as expiration approaches, which is exactly what happened in this example.

Next, we’ll look at a profitable long put spread position.

Trade Example #2: Profitable Bear Put Spread

In the previous example, we examined a gradual stock price decrease after buying an out-of-the-money put spread. In this next example, we’ll look at a situation where the stock price falls significantly after an at-the-money put spread is purchased.

Here are the trade details:

Initial Stock Price: $104.08

Put Strikes and Expiration: Long 115 Put for $15.85; Short 100 Put for $7.35; Both options expiring in 35 days

Put Spread Purchase Price: $15.85 Paid – $7.35 Received = $8.50 Net Debit

Breakeven Price: $115 Long Put Strike – $8.50 Net Debit = $106.50

Maximum Profit Potential: ($15-Wide Strikes – $8.50 Net Debit) x 100 = $650

Maximum Loss Potential: $8.50 Net Debit x 100 = $850

In this example, the purchased put is slightly above the stock price and the sold put is below the stock price, which results in a breakeven price right at the initial stock price. Many traders favor this type of setup because if the stock price doesn’t change, the put spread won’t make or lose much value.

In the previous example, the spread’s value decreased even as the stock price fell because the spread was entirely out-of-the-money at the time of entry, requiring a rapid stock price decrease for the trade to make money.

Let’s take a look at this next spread’s performance!

bear put spread 2

Long Put Spread #2 Trade Results

In this example, the put spread was profitable almost the entire period because the stock price fell to a level below the short put’s strike price early on. 

As time passed, the spread’s value slowly approached its maximum value of $15 (the difference between the 115 put and 100 put’s strike prices). 

If you’re wondering why the spread wasn’t maximally profitable right when the stock price fell below the short put’s strike price of $100, it’s because extrinsic value needs to come out of the options for the spread to reach its maximum value.

Decreasing extrinsic value occurs with the passage of time, as the option’s get further and further in-the-money, or a combination of the two.

In the final example, we’ll look at an in-the-money long put spread example.

Trade Example #3:

In the final example, we’ll examine an in-the-money put spread as the stock price increases steadily.

Here are the trade details:

Initial Stock Price: $127.88

Put Strikes and Expiration: Long 132 Put for $4.93; Short 128 Put for $2.13; Both options expiring in 31 days

Put Spread Purchase Price: $4.93 Paid – $2.13 Received = $2.80 Net Debit

Breakeven Price: $132 Long Put Strike – $2.80 Net Debit = $129.20

Maximum Profit Potential: ($4-Wide Strikes – $2.80 Net Debit) x 100 = $120

Maximum Loss Potential: $2.80 Net Debit x 100 = $280

In this case, the 132 put is purchased while the 128 put is sold. This particular put spread is entirely in-the-money since the stock price is below both of the put strikes at trade entry.

Regarding probabilities, the spread’s maximum profit is $120 while the maximum loss is $280. Additionally, the breakeven price is higher than the stock price, which means the share price can rise and the long put spread position can still profit. Both of these factors suggest a probability of profit that is greater than 50%.

Let’s see what happens with this trade:

ITM bear put spread

Long Put Spread #3 Trade Results

As illustrated in this example, the stock price began to rise right after the long put spread position was initiated. Because of this, the put spread’s value fell. In addition to the stock price rising, time decay also played a part in the collapse of the put spread’s value. When the stock price is above the spread’s breakeven price, the price of the spread will decay towards an unprofitable price as expiration approaches.

For example, with the stock price at $131, the spread would be worth $1 at expiration because the 132 put would be worth $1 and the $128 put would be worth $0. However, since the spread was bought for $2.80, the put spread buyer would lose $1.80 on the spread ($180 loss per spread).

At expiration, the stock price was trading for $131.88. Consequently, the 128 put expired worthless and the 132 was worth $0.12. The net loss in this case is equal to: ($0.12 final spread price – $2.80 initial sale price) x 100 = -$268.

Final Word

Well done! You’ve reached the end of the bear put spread strategy guide. Hopefully, you’re now much more comfortable with how the strategy works. Let’s now review what we have learned:

  • Bear put spreads are also called “long put spreads”.
  • In order to be a true vertical spread, both options in this strategy must be of the same expiration cycle.
  • Even when a underlying falls, the long put spread trader may still lose money due to time decay.
Chris Butler portrait

About the Author

Chris Butler received his Bachelor’s degree in Finance from DePaul University and has nine years of experience in the financial markets. 

Chris started the projectfinance YouTube channel in 2016, which has accumulated over 25 million views from investors globally.

Our Authors

Share this post

Leave a Reply

Your email address will not be published.