Historical Volatility Explained: Is it Useful to Options Traders?

Jump To

Most options traders tend to focus solely on implied volatility, which makes sense, as implied volatility is a forward-looking indicator based on the prices of a stock’s options. By analyzing implied volatility, options traders can determine the market’s expected price range for a stock in the future, as well as assess the current levels of option prices relative to historical “norms” for each particular underlying.

What is Historical Volatility?

Some traders like to also look at historical volatility, which is the annualized standard deviation of a stock’s past returns (usually daily returns). For example, if the standard deviation of a stock’s returns over the past 20 trading days (one month) is 2%, then the annualized 20-day historical volatility would be 31.7%:

2% Standard Deviation of Past 20 Daily Returns x SQRT(252 Trading Days Per Year)

= 31.7% 20-Day Historical Volatility

Refer to this article to learn more about calculating and interpreting historical volatility.

Options Trading for Beginners(2)(1)

New to options trading? Learn the essential concepts of options trading with our FREE 160+ page Options Trading for Beginners PDF.

Implied Volatility vs. Historical Volatility

Historical volatility can help traders understand a stock’s past price movements, which can then be compared to the expected price movements of the stock in the future (via implied volatility or the stock’s option prices).

For example, consider a scenario where a stock’s options are trading at a 20% implied volatility, but the stock’s 20-day historical volatility is only 10%. In this case, traders might view the stock’s options as a good sale since the options are implying a 20% annualized movement while the stock’s past returns are much less volatile.

On the other hand, if a stock’s options are trading at a 15% implied volatility, but the stock’s 20-day historical volatility is 25%, then traders might look to buy options because the option prices are lower than they should be (based on the volatility of the stock’s past movements).

Here’s a quick graph that shows the S&P 500 Index’s historical volatilities relative to the VIX Index:


SPX volatilities vs. VIX

Source: Yahoo! Finance

The above visual helps explain why the VIX has been trading at such a low level: the S&P 500’s realized movements have been minuscule. So, even with the VIX between 10-12.5, SPX options were still “overpriced” relative to the realized movements in SPX.

So, is historical volatility worth our attention as options traders, or should we exclusively look at implied volatility? For our first attempt at answering this question, we performed a simple test.

Study Methodology: Selling Straddles Based on the IV/HV Relationship

While there’s a great deal of research that can be conducted on this topic, today we’ll start with a basic test using short straddles on the S&P 500 ETF (SPY).

Here’s the methodology we used to test the validity of using historical volatility in the decision to enter a trade:

1. From 2007 to present, we compared S&P 500’s one-month implied volatility (the VIX Index) to the S&P 500’s one-month (20-day) historical volatility (HV).

2. On each trading day, we “sold” the at-the-money straddle in the standard expiration cycle with 25-35 days to expiration. If a standard expiration cycle did not meet that time frame, we skipped the date. This was done to keep an approximate 30-day trade time frame (since we are comparing one-month IV and HV).

3. Lastly, we divided all of the occurrences into four buckets based on the IV/HV relationship on the entry date:

  1. VIX at a 50% Premium to the 20-Day HV
  2. VIX at a 25-50% Premium to the 20-Day HV
  3. VIX at a 0-25% Premium to the 20-Day HV
  4. VIX Below the 20-Day HV

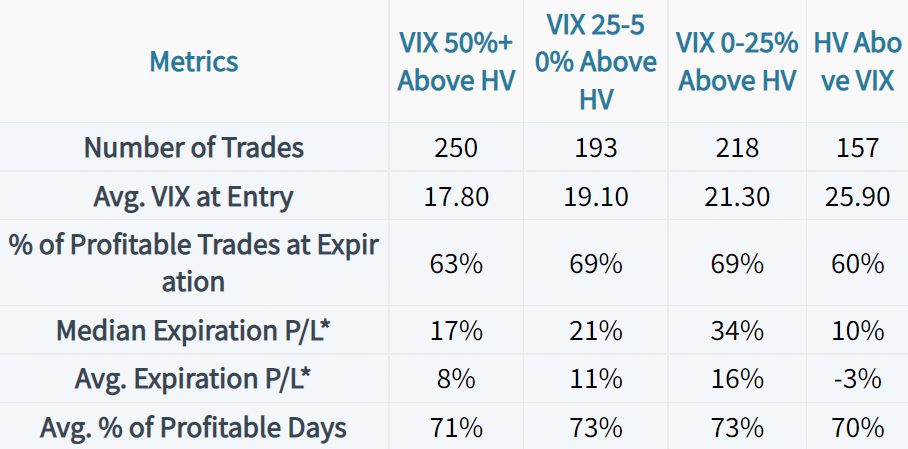
Each bucket had a similar number of trades.

Results: Entries Based on the IV/HV Relationship

Let’s take a look at various metrics related to the short straddle trades entered in each environment:

historical vol data

Based on this data, we can see that the trades entered when 20-day HV was below the VIX had noticeably better performance than the trades that were entered when 20-day HV was above the VIX. Most notably, the median expiration profit/loss was between 17-34% for the trades entered when HV was below IV. The trades that were entered when HV was above IV had a median expiration profit/loss of 10%.

Additionally, the trades entered when HV was above IV had slightly lower success rates and frequency of profitable trading days, though these differences were much smaller than the expiration profit/loss figures.

Options Trading for Beginners(2)(1)

New to options trading? Learn the essential concepts of options trading with our FREE 160+ page Options Trading for Beginners PDF.

Despite selling options with the highest average VIX levels (the most expensive options of the four buckets), selling 30-day SPY straddles when SPY’s 20-day historical volatility exceeded the VIX resulted in decreased performance relative to the trades that were entered when SPY’s 20-day historical volatility was below the VIX.

While this simple test certainly doesn’t put the nail in the coffin on the topic of using historical volatility for trade entries, it does indicate that the idea has legs.

Summary of Main Concepts

To quickly summarize what this post has covered, here are the key points to remember:

  • Implied volatility is a forward-looking indication of a stock’s expected price movements based on the prices of the stock’s options. Historical volatility is a backward-looking indicator that quantifies the annualized standard deviation of a stock’s past price changes.

  • Some traders prefer to only look at implied volatility, while some like to analyze implied volatility and historical volatility together.

  • Based on our preliminary analysis, 30-day SPY short straddles entered when the S&P 500’s implied volatility exceeded its 20-day (one-month) historical volatility outperformed trades in which the 20-day historical volatility exceeded the current implied volatility.

  • The findings suggest that premium sellers may benefit from selling options when implied volatility exceeds the 20-day historical volatility.

  • In a similar vein, premium buyers may benefit from buying options when the 20-day historical volatility exceeds the current implied volatility.
Chris Butler portrait

About the Author

Chris Butler received his Bachelor’s degree in Finance from DePaul University and has nine years of experience in the financial markets. 

Chris started the projectfinance YouTube channel in 2016, which has accumulated over 25 million views from investors globally.

Our Authors

Share this post

Leave a Reply

Your email address will not be published.