The Cost of Trading Volatility: VXX In Depth

Jump To

When trading volatility products, it’s imperative that you’re aware of the costs associated with the positions you enter. More specifically, being aware of the current VIX term structure (VIX futures curve) as it relates to historical levels can help you make more informed volatility trading decisions.

My First Volatility Mishap

In May of 2014, I had just purchased my first VIX futures contract. The reason for the trade was that implied volatility was low and the market had been grinding steadily higher without any breathers to the downside, and I anticipated a reversion in volatility. At the time, I had overlooked the fact that VIX futures converge towards the VIX Index as time passes, and when volatility is low, VIX futures typically trade at a premium to the VIX. The result? Steady losses on long VIX futures contracts (and other long volatility strategies/products) when market implied volatility remains low.

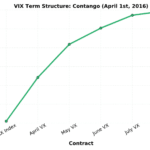
If you look at the graph below, you’ll notice that the front-month VIX futures are consistently above the VIX Index when the VIX is at suppressed levels (a structure referred to as “contango”):

SPX VIX Contango

Data compiled from Yahoo! Finance and CBOE VIX Futures Data.

When the VIX term structure is in contango, long volatility traders pay the price, and must correctly time the inevitable volatility increase to avoid the costs of contango. If the timing is off, the losses from contango lead to an increase in the cost basis of long volatility trades, which means a more significant increase in volatility is needed to break even or profit.

NOTE! In March, 2022, Barclay’s suspended sales and issuance of VXX. Read about other volatility finds in our article: “VXX Alternatives“.

Historical VIX Term Structure Levels

So, how often is the VIX futures curve in contango and backwardation? Here are the historical spreads between the front-month VIX Future and the VIX Index since 2008:

VIX Contango

As we can see, the difference between the front-month VIX future and the VIX Index is typically positive, indicating that the VIX Index is at a discount to the front-month VIX future. Let’s take a look at some metrics that describe the spread’s history since 2008:
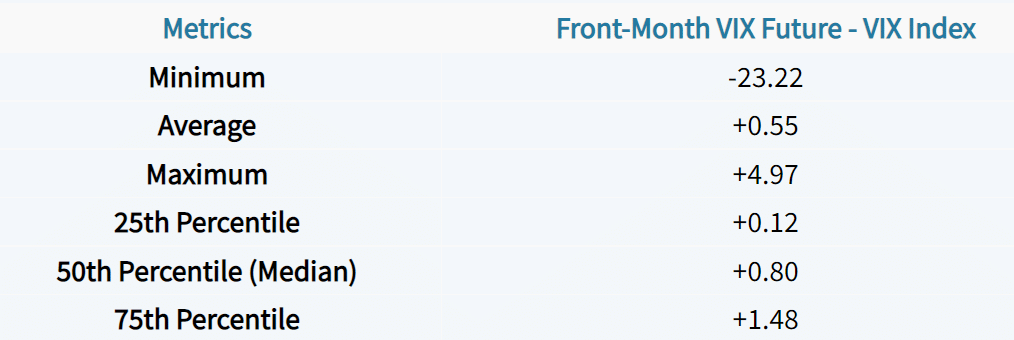
Interestingly, the median spread between the front-month VIX future and the VIX Index has been +0.80. When purchasing a VIX future at an $0.80 premium to the VIX Index, the potential loss from holding the contract when volatility doesn’t expand is $800 ($0.80 Loss Per Contract x $1,000 Contract Multiplier). The higher the spread, the higher the potential costs of buying volatility.

VIX Term Structure and Daily VXX Performance By Year

VIX futures are not alone in terms of the costs of trading volatility. A popular volatility ETN under the ticker symbol VXX tracks the performance of the two nearest-term VIX futures contracts. The result? Poor performance when the VIX futures curve is in contango (which, as we know, is the case most of the time).

Let’s take a look at the median premium of the front-month VIX future (M1) to the VIX Index, the median relationship between the second-month VIX futures contract (M2) and the front-month VIX futures contract, and the median daily VXX changes:

Just to clarify, the M2 / M1 relationship is important because VXX tracks an index that “rolls” the front-month futures (M1) to the second-month futures (M2) on a daily basis. When the M2 contract is at a more significant premium to the M1 contract, it’s an indication that near-term contango is steep and that VXX faces larger losses if the VIX remains low.

Implications for Trading Volatility

As we can see from this data, the contango has been very steep in 2017 (and since the U.S. election) relative to previous years. What are the implications of this? Well, steep contango will lead to more significant losses when trading volatility to the long side if the VIX remains suppressed, requiring more accurate timing of increases in market volatility.

So, while market implied volatility is currently at an extreme, understand that the costs associated with trading long volatility positions are high relative to historical norms. Does this suggest that shorting volatility is the better play? While short volatility strategies will perform considerably well if the VIX structure remains in its current state, there’s always the potential for a significant spike in volatility, especially with the VIX below 12. So, the risk/reward for shorting volatility at these levels won’t make sense for most traders.

At the very least, it’s interesting to see how significant the current volatility risk premium is relative to historical levels, and it should help volatility traders make more informed trading decisions.

Options Trading for Beginners(2)(1)

New to options trading? Learn the essential concepts of options trading with our FREE 160+ page Options Trading for Beginners PDF.

Chris Butler portrait

About the Author

Chris Butler received his Bachelor’s degree in Finance from DePaul University and has nine years of experience in the financial markets. 

Chris started the projectfinance YouTube channel in 2016, which has accumulated over 25 million views from investors globally.

Our Authors

Share this post

Leave a Reply

Your email address will not be published.