(1)")
Now that you know some of the best practices, it’s time to perform some calculations. Here is the expected move formula:
If you wish to use trading days instead of calendar days, just change the denominator from 365 to 252, since there are 252 trading days in a year. Both calculations will result in virtually the same number.
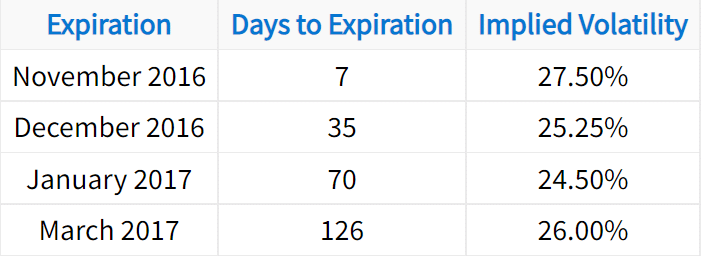
Using the formula and table from above, let’s calculate the expected move for each time period. Let’s assume the current stock price is $200:
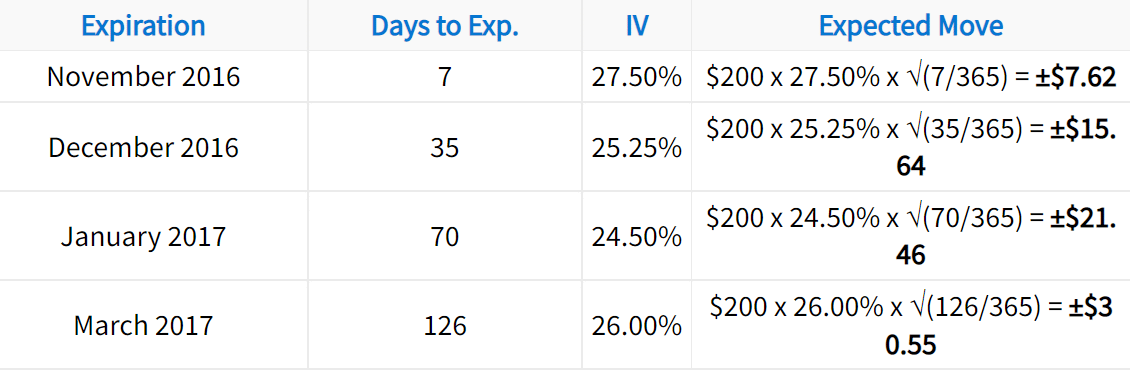
The expected moves in this table suggest the following:
➜ The 7-day option prices are implying a 68% probability that the stock price is ±$7.62 from $200 in seven days (between $192.38 and $207.62).
➜ The 35-day option prices are implying a 68% probability that the stock price is ±$15.64 from $200 in 35 days (between $184.36 and $215.64).
➜ The 70-day option prices are implying a 68% probability that the stock price is ±$21.46 from $200 in 70 days (between $178.54 and $221.46).
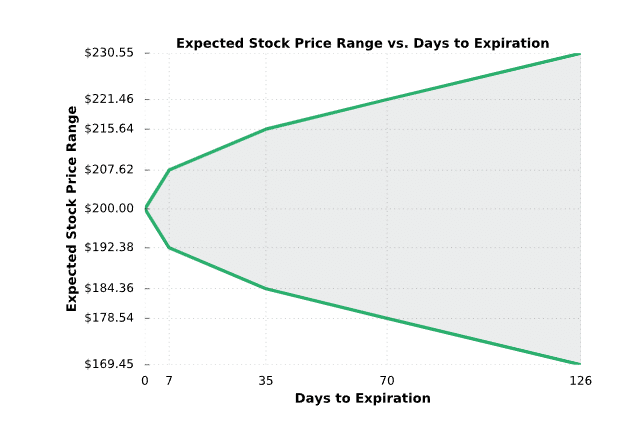
➜ The 126-day option prices are implying a 68% probability the stock price is ±$30.55 from $200 in 126 days (between $169.45 and $230.55).
The following chart serves as a visualization for the table above:
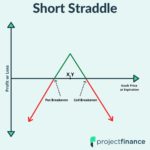
Calculating the Expected Move With Straddles
This calculation involves taking 85% of the value of the front-month at-the-money (ATM) straddle. The resulting figure is a good ballpark number to determine a stocks expected move.
Why does this matter to you as an options trader? Knowing how much a stock’s price is expected to fluctuate over various time periods can give you a reasonable expectation for a stock’s future prices. Additionally, if you want to calculate a stock’s expected range over a specific period of time, you have the ability to do so.


2 thoughts on “Expected Move Explained: Options Trading”
What if the stock price is not trading at the strike price when determining the “at-the-money” straddle? Like if the stock is at $132 and the only strike prices are $130 and $135? Which ones do you use?
Thanks for the question Hank. This can be tricky indeed. If the stock is trading in between the two strike prices, you can just use the average of the two straddles. Alternatively, you can use the equation in this article. Hope this helps!
Mike