Implied Volatility Definition: In the financial markets,Implied Volatility (IV) represents the expected volatility of a stock, ETF, or index over the life of an option. IV helps to determine the prices of options.
There are few trading terms more daunting to the beginner options trader than implied volatility.
However, when broken down into its parts and looked at visually, this concept can be mastered by anyone willing to take the time to learn.
If you want to become a serious options trader, you must understand implied volatility. It’s that simple.
Let’s get started!
Jump To
TAKEAWAYS
Implied volatility uses options to forecast the likely future movement of a security’s price
IV can help predict future price movements caused by upcoming earnings, economic data and interest rates.
Historical volatility measures past moves in a stock’s price over a predetermined time frame
1 Standard Deviation includes 68% of outcomes; 2 Standard Deviations includes 95% of outcomes
IV (Implied Volatility) Rank tells traders whether implied volatility is high or low based on IV data from the past year
IV (Implied Volatility) Percentile is frequency-based. This measure shows traders how often a stocks implied volatility has been below the current level of implied volatility over the past year.
What is Implied Volatility?
Aside from being vehicles of hedging and market speculation, options (derivatives) also help traders to predict future stock movements.
They do this by incorporating components of the Black-Scholes option pricing model formula relating to the price variation of options contracts.
To better understand how options are able to do this, let’s jump right into an example by comparing the option premiums on two different stocks with similar prices.
PEP Option: 37 Days to Expire
Stock: $102
105 Strike Call Option Price: $0.80
100 Put Price: $1.17
Implied Volatility: 16.4%
UNP Option: 37 Days to Expire
Stock: $103.60
105 Strike Call Option Price: $2.72
100 Put Price: $1.92
Implied Volatility: 30.9%
Let’s first note the different prices of these stocks. PEP is trading at $102; UNP is trading at $103.60. These prices are quite similar. However, we can see that the options on UNP are trading substantially higher than the selfsame options on UNP. Why are the options premiums on UNP so much higher? Because the implied volatility on UNP is higher!
The high premiums on UNP, therefore, suggest that the underlying stock is expected to move further (either up or down) than the stock of PEP.
New to options trading? Learn the essential concepts of options trading with our FREE 160+ page Options Trading for Beginners PDF.
Implied Volatility and Extrinsic Value
An option’s premium consists of extrinsic and/or intrinsic value. When we’re talking implied volatility, we are focusing only on the extrinsic value of an options price.
Implied volatility represents the amount of extrinsic value that exists in a stock’s options relative to the time until the expiration date.
Option Buying/Selling and Implied Volatility
When options buyers pay a high amount of premium for call and put options, the sellers of those options must therefore receive substantial credits.
Therefore, high volatility is implied by the option prices.
When option buyers pay relatively small amounts of premium for long call and long put options, option sellers receive small credits as well. This means that neither party is expecting the underlying asset price to move by much.
Here, low volatility is implied by the option prices.
So, what makes traders pay high premiums for some options? It’s not completely arbitrary – there is a method in the madness of options pricing.
The answer to this lay in “historical volatility”. Let’s compare this term to implied volatility next.
Implied Volatility vs Historical Volatility
Historical Volatility Definition: A statistical indicator that measures the historical return distribution for a security over a predetermined period of time.
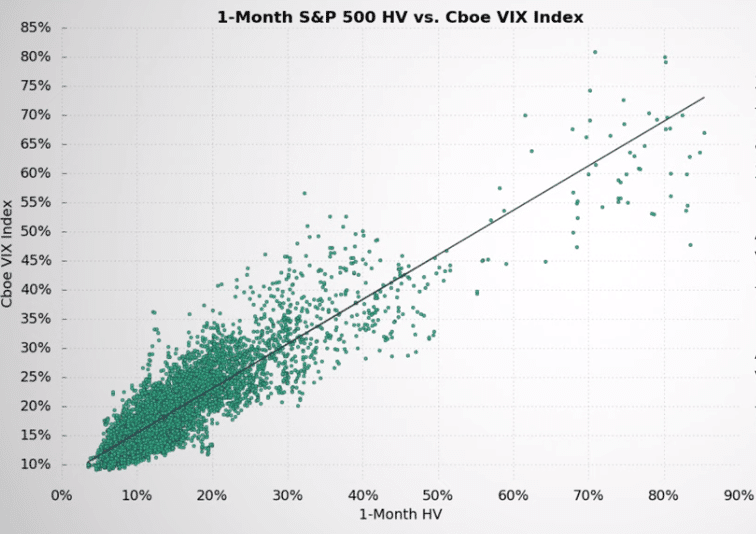
The above image compares the one-month historical volatility of the S&P 500 against the VIX index after recording the levels of observed volatility.
The VIX measures one-month option prices on the S&P 500 index. By comparing the S&P 500 historical volatility to the VIX index, we can draw a conclusion as to whether or not historical volatility has any impact on the S&P 500 options prices.
We can draw three conclusions from the above comparison:
S&P 500 option prices (as measured by the VIX Index) are closely related to the amount of historical volatility in the S&P 500.
At low levels of historical volatility, the VIX Index (one-month SPX option prices) tends to be low.
At higher levels of historical volatility, the VIX Index (one-month SPX option prices) tends to also be high.
To conclude, historical volatility looks at past volatility while implied volatility looks at future volatility.
Implied Volatility and Probability
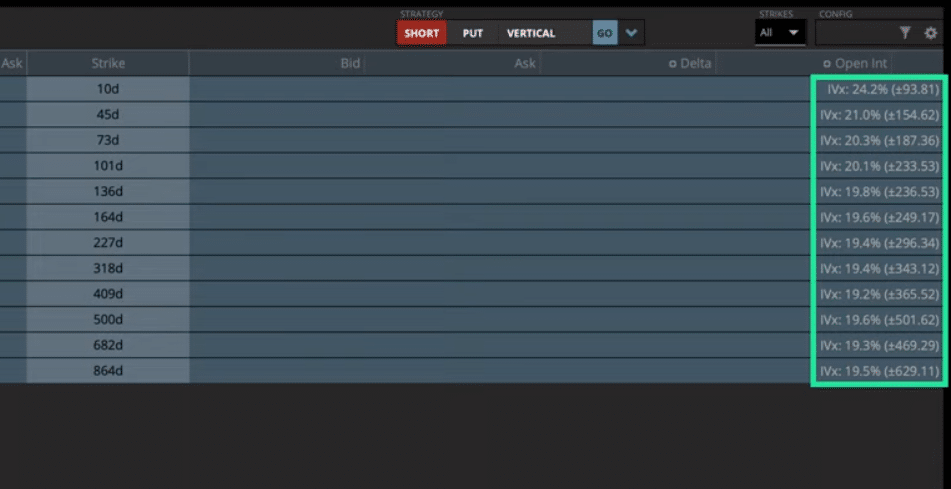
When you look at an options chain, you will see that every option expiration cycle has an implied volatility (IV) level associated with it.
So what does the implied volatility of an option actually represent? Let’s break this number down.
The IV percentage in our above options chain represents the “one standard deviation” stock price movement over a one-year period.
In statistics, a one standard deviation range encompasses about 68% of the outcomes around the mean/average.
Expected Range Formula
In the stock market, this mean/average is the current price of a stock. Here is the formula to compute this:
1 – Year Expected Range = Stock Price +/- (Stock Price x Implied Volatility)
Let’s take a look at a few examples now to really understand this.
Expected Range Example
Below you will find our trade details.
NFLX Trade Details
Stock: $374
IV: 39%
1 SD Range (1 Year): $228.14 – $519.86
The above information tells us there is a 68% probability (1 SD) that NFLX is within +/- 39% of its current price of $374 in one year.
Let’s take a look at one more example.
KO Trade Details
Stock: $52
IV: 20%
1 SD Range (1 Year): $41.60 to $62.40
In this trade, there is an estimated 68% chance that KO is within +/- 20% of its current price of $52 in one year. Pretty simple, right?
Let’s next take some time to visualize SD and implied volatility.
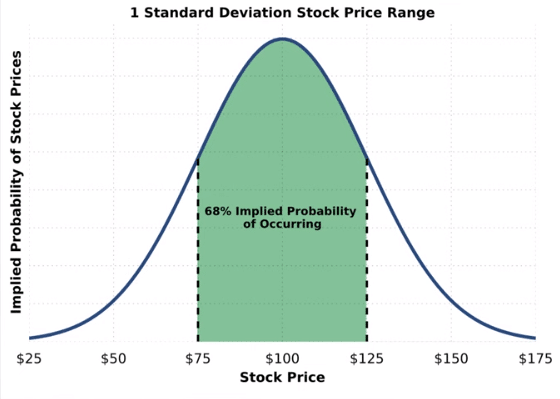
1 Standard Deviation Explained
The above chart shows a $100 stock with 25% implied volatility. 68% of the area under the curve falls between $75 and $125, indicating that the market is implying a 68% probability that the stock price is between these two levels one year from today.
This doesn’t mean that the stock price won’t trade beyond this price, but it does imply the odds of this happening are relatively low.
So this chart shows a 1 standard deviation move; what about 2 and even 3 standard deviation moves – what will they look like?
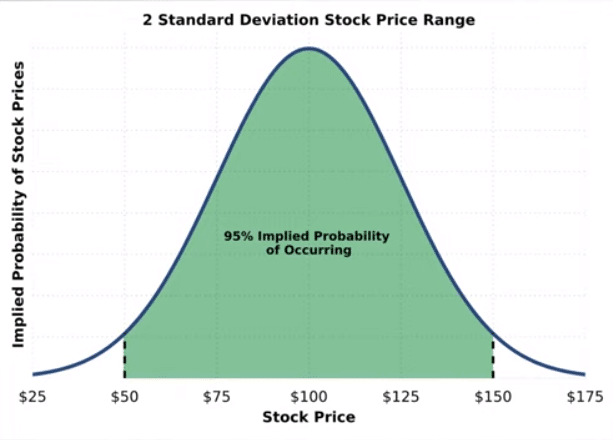
2 Standard Deviation Explained
The above image shows a $100 stock at 25% implied volatility. Simply multiplying the 1SD range by 2 gives us the 2SD range, which is the implied 95% probability range.
1SD Range (68%) = +/- $25
2SD Range (95%) = +/- $75
So all this tells us is that our stock has a 95% chance of remaining between $50 and $150 one year in the future.
Every stock has its own level of volatility. Some stocks are high volatility; others are low. Let’s next compare these two.
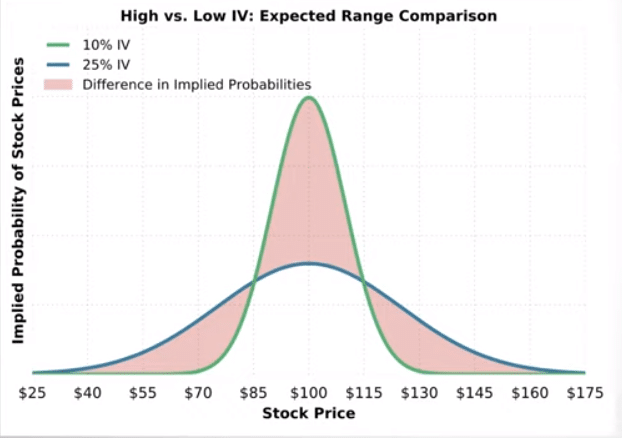
Low IV vs High IV
The above chart compares two similarly priced stocks; one with a 10% IV (green) and another with a 25% IV (blue).
We can see that the 10% IV stock (which has cheaper option prices) is not expected to deviate too far from its current price of $100.
On the other hand, the 25% IV stock (which has very expensive options) is implying large stock price fluctuations in the future price (relative to the 10% IV).
Again, this information is all relayed to us via the options market. In an environment where the stock price is the same, the stock with a higher IV is expecting to move more (in either direction) and therefore has higher-priced options.
IV Rank and IV Percentile
These two implied volatility metrics help traders to determine whether a stock’s IV is currently high or low relative to the stock’s historical levels of IV.
By only looking at a stock’s current IV, it is not immediately clear whether that level of IV is low or high.
In order to determine whether a stock’s IV is fairly priced, traders look to IV Rank or IV Percentile.
Both of these metrics measure a stock’s current IV against its historical levels of implied volatility. Let’s look at these closer next.
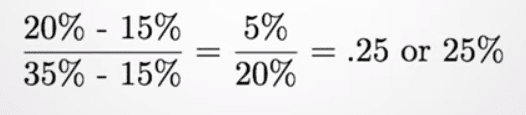
Implied Volatility Rank
IV Rank is a calculation that takes a stocks current level of IV and compares this with the highest IV as well as the lowest IV that has been observed in that stock over the past year.
Here is the formula for this:
A 20% IV stock with a one-year IV range between 15% and 35% plugged into this formula would appear as below:
Different IV ranks can tell us many things.
An IV rank of 0% indicates the current implied volatility is the lowest its been over the past year
An IV rank of 50% indicates the current implied volatility is at the midpoint of the IV range seen over the past year
An IV rank of 100% indicates the current implied volatility is the highest its been over the past year
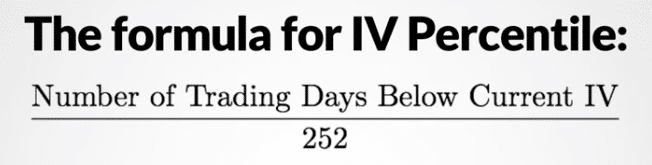
Implied Volatility Percentile
Unlike IV Rank, IV percentile is frequency-based. IV percentile shows us how often a stocks implied volatility has been below the current level of implied volatility over the past year.
For example, an IV Percentile of 85% means the stock’s IV has been below its current IV level on 85% of days over the past year.
Here is the formula used to reach this figure:
We are dividing by 252 and not 365 because there are only 252 trading days in a year.
For example, if a stock’s IV has been below the current IV on 180 of the past 252 trading days, the IV percentile would be:
This IV percentile of 71.42% means the stock’s IV has been below its current IV on 71.42% of trading days over the past year.
IV Rank vs IV Percentile: Which is Better?
Every trader has their own preference here. However, one of the limitations of IV rank is that it does not tell you the frequency at which a stocks implied volatility was lower than the current level of implied volatility.
Instead, IV Rank simply tells us where a stock’s current level of IV falls within the one year IV range.
A downside of IV Rank is that after a period of abnormally high IV, the IV Rank will come in at lower readings for almost all levels of IV into the future, regardless of whether or not that level of IV is still high or low.
To prove this, lets compare S&P 500 implied volatility to IV Rank.
S&P 500 IV vs IV Rank
If you focus on the left side of the chart, you’ll see the S&P 500 IV was around 22.5%, which translated to an IV Rank of over 75%.
However, later on in the year, IV spiked to 40%. In the shaded region on the right of the graph, you’ll notice that the IV rose to 25% but the IV Rank was less than 50%.
When IV falls after a surge in IV, IV Rank readings will be low even when the IV of a stock is still relatively high.
In this example, the IV of the S&P 500 is below 20% most of the year, but after the spike in IV, the subsequent IV of 25% translated to an IV Rank of less than 50% later in the year.
Let’s look at how IV Percentile tracks the S&P 500 IV next.
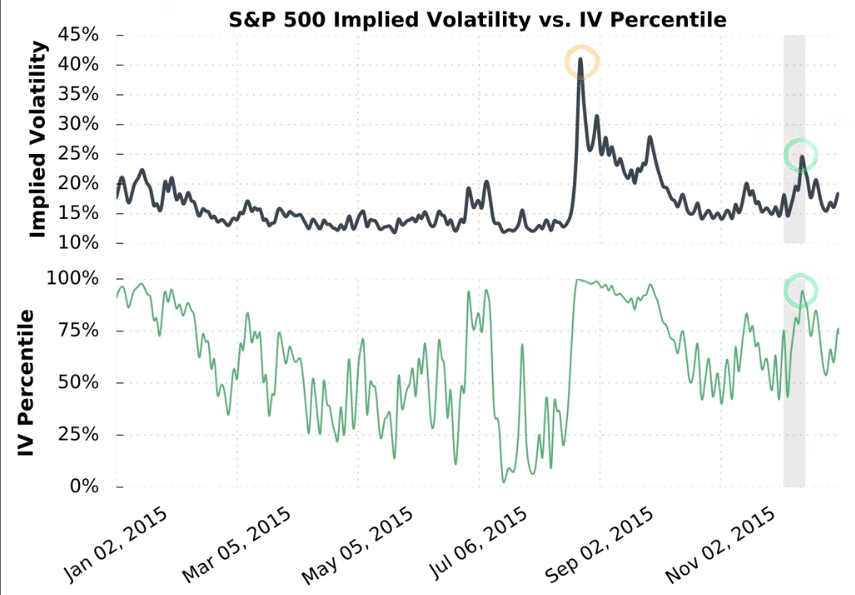
S&P 500 IV vs IV Percentile
The above chart compares the S&P 500 implied volatility to IV Percentile.
Since IV Percentile is frequency based, this metric falls more in line with the S&P 500 implied volatility. Therefore, this measure gives us a better representation of true market volatility over periods of time.
Final Word
This material should get you started on your journey to learning about implied volatility. If you’d like to learn more, please check out Chris Butler’s video on the subject, which builds upon the topics in this article as well as expands into the world of implied volatility and company earnings.
Higher levels of IV (implied volatility) result in higher option premiums. Therefore, if you are selling options, a higher IV means a higher reward. Of course, higher reward potential comes with greater risk.
Determining the ideal level of IV will depend on your options trading strategy. Generally, option sellers prefer a high IV when entering trades, and a lower IV over the course of the options life.
Volatility, also known as historical volatility, represents the past volatility of a stock, ETF, or index. Implied volatility represents the future potential volatility of a security, as measured by that securities option prices.
Mike was a writer for projectfinance. He has spent over 15 years in the finance industry, working for such companies as thinkorswim, TD Ameritrade and Charles Schwab. His work has appeared in the Financial Times, the Chicago Sun-Times, and The Buffalo News.
Share this post
2 thoughts on “Implied Volatility Explained (The ULTIMATE Guide)”
Thanks for the article! What exactly does “vol crush” mean? Is this related to implied volatility?
Vol crush is a term used to describe the rapidity at which option premiums fall in price after the issuance of news. This term is generally used with earnings. Before a company reports its earnings, there is a lot of uncertainty. This results in higher implied volatility levels. However, after the earnings are released (generally speaking), option premiums fall in value.
(1)")
")


2 thoughts on “Implied Volatility Explained (The ULTIMATE Guide)”
Thanks for the article! What exactly does “vol crush” mean? Is this related to implied volatility?
Thanks for the question Pete!
Vol crush is a term used to describe the rapidity at which option premiums fall in price after the issuance of news. This term is generally used with earnings. Before a company reports its earnings, there is a lot of uncertainty. This results in higher implied volatility levels. However, after the earnings are released (generally speaking), option premiums fall in value.