Last updated on February 10th, 2022 , 01:18 pm
The long straddle is an option strategy that consists of buying a call and put on a stock with the same strike price and expiration date. Since the purchase of an at-the-money call is a bullish strategy, and buying a put is a bearish strategy, combining the two into a long straddle technically results in a directionally neutral position. However, a long straddle requires a significant shift in the stock price to profit, though the direction doesn’t matter. Because of this, a buying straddles is essentially a long or positive gamma strategy.
When buying straddles, profits come from large movements in the stock price or increases in implied volatility, as long as too much time doesn’t pass before either of those events happen.
TAKEAWAYS
- A straddle consists of buying both a call and put option on the same security, strike price, and expiration date.
- In a long straddle, both the call and put options are purchased
- Long straddles benefit from either large upside or downside movements in an underlying.
- At-the-money straddles on near-term options assist traders in forecasting a stock’s expected move.
Jump To
Options Strategy Characteristics
Let’s go over the long straddle strategy’s general characteristics:
➥Max Profit Potential: Unlimited
➥Max Loss Potential: Net Debit x 100
➥Expiration Breakeven
Upper Breakeven = Strike Price + Debit Paid
Lower Breakeven = Strike Price – Debit Paid
To demonstrate these characteristics in action, let’s take a look at a basic example.
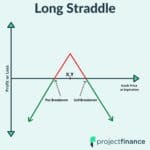
Long Straddle Profit/Loss Potential at Expiration
In the following example, we’ll construct a long straddle from the following option chain:
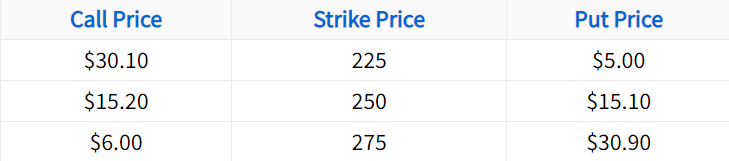
In this case, we’ll buy the 250 call and 250 put. Let’s also assume the stock price is $250 when entering the trade.
Initial Stock Price: $250
Long Strikes Used: 250 put, 250 call
250 Put Purchase Price: $15.10
250 Call Purchase Price: $15.20
Total Debit Paid: $15.10 + $15.20 = $30.30
The following visual describes the potential profits and losses at expiration when buying this particular straddle:
Long Straddle at Expiration
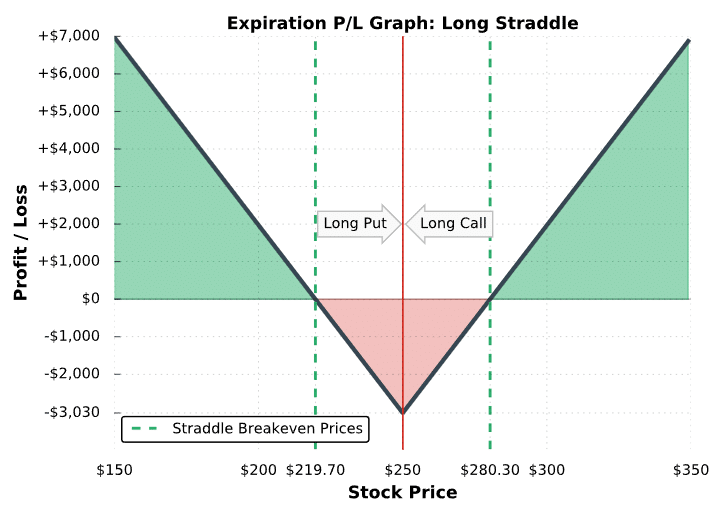
As illustrated here, a long straddle realizes the maximum loss potential when the stock price is trading exactly at the long strike at expiration. Because of this, achieving maximum loss on a long straddle is very unlikely. Regarding profits, we can see that a large movement in the stock price is required for the straddle to be profitable at expiration. In this example, the stock price has to move ±12% in either direction just to break even, which makes buying straddles a low probability trade.
The table below explains the performance of this position based on various scenarios at expiration:
Stock Price Below the Lower Breakeven Price ($219.70)
The 250 call expires worthless but the long 250 put has more intrinsic value than the entire straddle was purchased for ($30.30), and therefore the straddle buyer realizes profits.
Stock Price Between the Lower Breakeven and the Long 250 Put ($219.70 to $249.99)
The 250 call expires worthless. The 250 put has intrinsic value, but not more than the premium the trader paid when buying the straddle. Consequently, the long straddle position is not profitable.
Stock Price Exactly at $250
Both the 250 call and 250 put expire worthless. The long straddle trader ends up with the maximum loss potential.
Stock Price Between the Long Call Strike and the Upper Breakeven ($250.01 to $280.30)
The 250 put expires worthless. The 250 call has intrinsic value, but not more than the premium the trader paid when buying the straddle. Consequently, the long straddle position is not profitable.
Stock Price Above the Upper Breakeven ($280)
The 250 put expires worthless but the 250 call has more intrinsic value than the straddle was bought for, and therefore the long straddle position is profitable. Since the stock price can rise indefinitely, the long call (and consequently the entire long straddle) has unlimited profit potential.
So, you know how the potential outcomes at expiration, but what about before expiration? Understanding how profits and losses occur when buying straddles can be explained by the position’s option Greeks (if you want to improve your understanding of option risks, read our ultimate guides on the option Greeks).
Option Greek Exposures When Buying Straddles
The option Greeks describe the various risks of an option position. In the following table, we’ll discuss the general Greek exposures of a long straddle position.
Delta: Generally speaking, a long straddle’s position delta will start near zero if the trader buys an at-the-money straddle (e.g. a -50 delta long put and a +50 delta long call). However, as the stock price changes, a long straddle will take on a positive or negative delta position.
Gamma: Positive – When the stock price rises, a long straddle becomes directionally long because the delta of the long call becomes more significant while the delta of the long put diminishes. On the other hand, when the stock price falls, a long straddle becomes directionally short because the delta of the long put becomes more significant while the delta of the long call diminishes. The concept of positive gamma will be discussed further in the example trades.
Theta: Negative – The extrinsic value of options decays as time passes, which is harmful to straddle buyers.
Vega: Positive – An increase in implied volatility suggests an increase in option prices, which is excellent for straddle buyers. On the other hand, a decrease in implied volatility suggests falling option prices, which is detrimental to straddle buyers.
When buying straddles, the main profit drivers are increases in implied volatility and large stock price changes.
As time passes, the extrinsic value of options decays away, leading to losses for option buyers. Consequently, to be profitable when buying straddles, large stock price movements or increases in implied volatility must occur in short periods of time.
Nice job! Next, we’ll go through some visualized trade examples to observe the performance of long straddles through time.
(1)")
New to options trading? Learn the essential concepts of options trading with our FREE 160+ page Options Trading for Beginners PDF.
Long Straddle Trade Examples
In this section, we’re going to visualize the performance of long straddles relative to changes in the stock price. Note that we don’t specify the underlying, since the same concepts apply to long straddles on any stock.
Additionally, each example demonstrates the performance of a single position. When trading more contracts, the profits and losses in each case would be magnified by the number of straddles traded.
Let’s do it!
Trade Example #1: Significant Long Straddle Loss
The first example we’ll look at is a situation where the stock price trades in a tight range after an at-the-money straddle is purchased.
Here are the trade details:
Initial Stock Price: $210.72
Initial Implied Volatility: 15%
Strikes and Expiration: 211 put and 211 call expiring in 77 days
Straddle Purchase Price: $5.46 for the put and $4.32 for the call = $9.78 total debit paid
Breakeven Prices: $201.22 and $220.78 ($211 – $9.78 and $211 + $9.78)
Maximum Profit Potential: Unlimited
Maximum Loss Potential: $9.78 total debit x 100 = $978
Let’s see what happens!
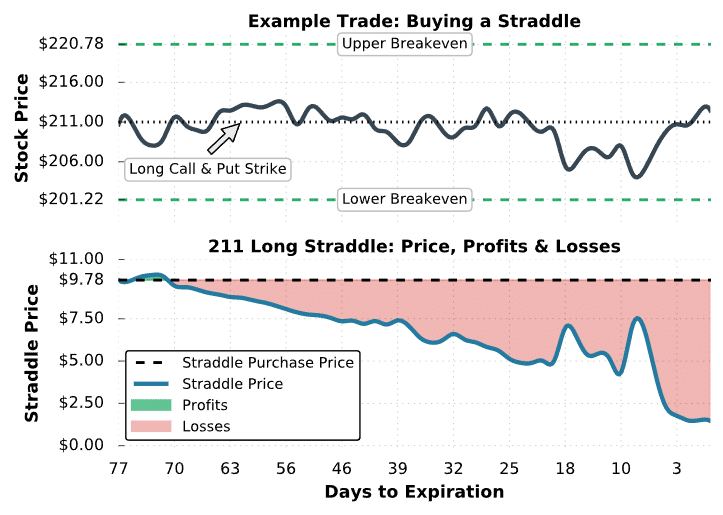
Long Straddle #2 Trade Results
As you can see, buying straddles is not profitable when the stock price doesn’t rise or fall quickly with magnitude. In this case, the stock price traded near the long strike the entire time, leading to losses from time decay. Additionally, implied volatility remained around 15% the entire period, so profits from an implied volatility increase didn’t occur.
In this example, the straddle price continously fell. To lock in the profits or losses on a long straddle position, the long options can be simultaneously sold at their current prices. For example, if the trader in this position sold the straddle for $4.00, they would have locked in a $578 loss: ($4.00 sale price – $9.78 purchase price) x 100 = -$578.
At expiration, the stock price was above $211, which means the long call was in-the-money and the long put was out-of-the-money. However, the long 211 call only had $1.50 of intrinsic value at expiration, which results in a $828 loss for the straddle buyer: ($1.50 straddle value at expiration – $9.78 initial purchase price) x 100 = -$828.
At expiration, the trader would end up with +100 shares of stock if the in-the-money 211 call was held through expiration. To avoid a stock position, the call would need to be sold before expiration.
The example above demonstrates what can go wrong when buying straddles. In the next demonstration, we’ll look at a scenario where a long straddle position turns into a big winner.
Trade Example #2: Immensely Profitable Straddle Purchase
In the next example, we’ll look at how a long straddle performs when the stock price falls significantly. In particular, we’ll examine a long straddle position on a stock in late 2008.
Here are the trade details:
Initial Stock Price: $126.20
Initial Implied Volatility: 23%
Strikes and Expiration: 126 put and 126 call expiring in 78 days
Straddle Purchase Price: $5.18 for the put + $5.07 for the call = $10.25 total debit paid
Breakeven Prices: $115.75 and $136.25 ($126 – $10.25 and $126 + $10.25)
Maximum Profit Potential: Unlimited
Maximum Loss Potential: $10.25 debit x 100 = $1,025
Let’s see how the trade performed:
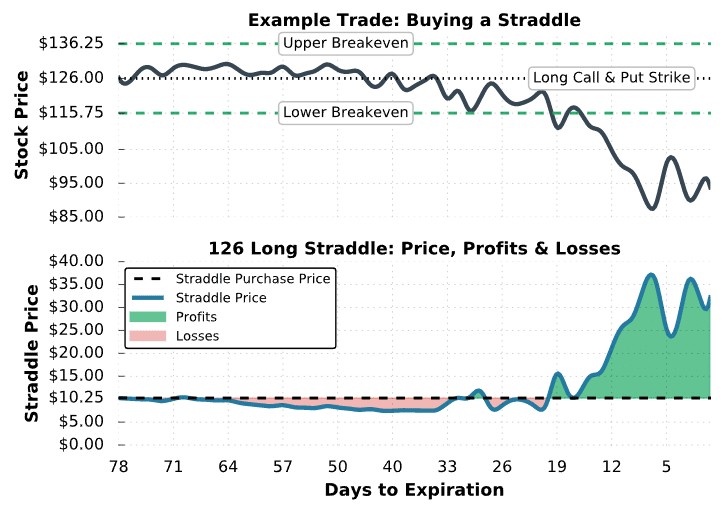
Long Straddle #2 Trade Results
As you can see here, the long straddle position performed poorly in the first 40 days of the period. However, the stock price suddenly collapsed from $125 to $95. At the same time, implied volatility in the expiration cycle of the long straddle spiked to over 75%. Consequently, the price of the 126 straddle surged in price to $35. With an initial purchase price near $10, the profit is $2,500 per long straddle when the straddle is worth $35: ($35 straddle price – $10 purchase price x 100) = +$2,500.
If the trader wanted to take profits before expiration, the straddle can be sold at its current price. For example, if the straddle was sold for $25, the trader would have locked in $1,475 in profits: ($25 sale price – $10.25 initial purchase price) x 100 = +$1,475.
At expiration, the stock price was $31 below the straddle’s strike price of $126, which translates to $31 of intrinsic value for the 126 put and $0 of intrinsic value for the 126 call. Because of this, the expiration profit for the straddle buyer is $2,075: ($31 expiration straddle value – $10.25 initial purchase price) x 100 = +$2,075.
If held through expiration, the long 126 put would become -100 shares of stock. So, if the trader wanted to avoid a stock position, the long 126 put would need to be sold before expiration.
Changes in a Long Straddle's Directional Exposure (Positive Gamma Demonstration)
In addition to demonstrating the potential profits from buying straddles, this example serves as an excellent demonstration of how a straddle’s delta can change rather quickly. As mentioned earlier, a long straddle position has positive gamma, which means that as the stock price trends in one direction, the delta (directional exposure) of the position will grow in the same direction. For example, if the stock price increases, the delta of a long straddle position will become more positive, resulting in a bullish position. Conversely, when the stock price decreases, the delta of a long straddle position will grow more negative, resulting in a bearish position.
Let’s visualize the concept of positive gamma using the same example as above:
Option Straddle and Gamma
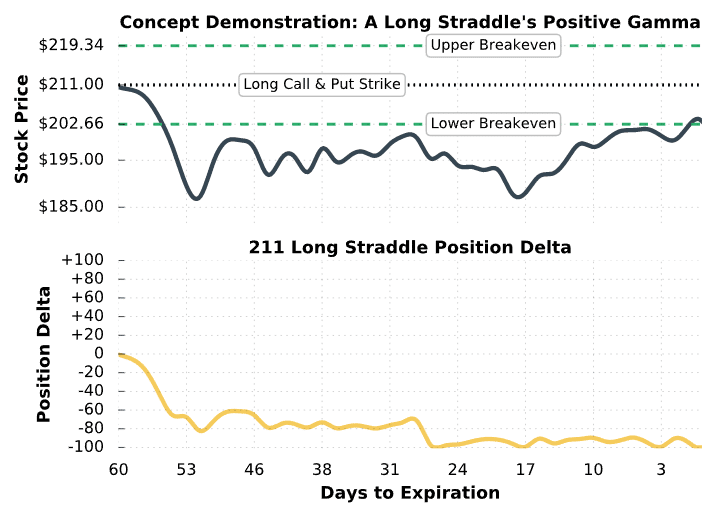
As visualized here, the position delta of the long straddle moves with the stock price. When the stock price increases, the position delta becomes more positive, which means the position is more bullish. When the stock price decreases, the position delta becomes more negative, which means the position is more bearish. Intuitively, this should make sense because the profit potential of a long straddle occurs when the stock price changes significantly in one direction.
Therefore:
➜ When the stock price falls below the strike price, the position becomes bearish because the ideal scenario is for the stock price to continue falling.
➜ When the stock price rises above the strike price, the position becomes bullish because the best case scenario is for the stock price to fall to continue rising.
In this example, the delta of the long straddle turned negative when the stock price fell. As a result, further stock price decreases lead to profits for the straddle buyer, explaining why a long straddle benefits from continued stock price movements in one direction.
Lastly, at expiration, the straddle’s position delta is -100. Since an in-the-money long put expires to -100 shares of stock, the position delta of -100 makes sense.
In the final example, we’ll look at an example where a straddle buyer doesn’t make or lose much money.
Trade Example #3: Breakeven Straddle Purchase
In the final example, we’ll look at a scenario where a long straddle trader doesn’t make or lose much money, which occurs when the stock price is near one of the straddle’s breakeven prices at expiration.
Here are the trade details:
Initial Stock Price: $210.56
Strikes and Expiration: 211 put and 211 call expiring in 60 days
Straddle Purchase Price: $4.83 for the put + $3.51 for the call = $8.34 total debit paid
Breakeven Prices: $202.66 and $219.34 ($211 – $8.34 and $211 + $8.34)
Maximum Profit Potential: Unlimited
Maximum Loss Potential: $8.34 net debit x 100 = $834
Let’s see what happens!
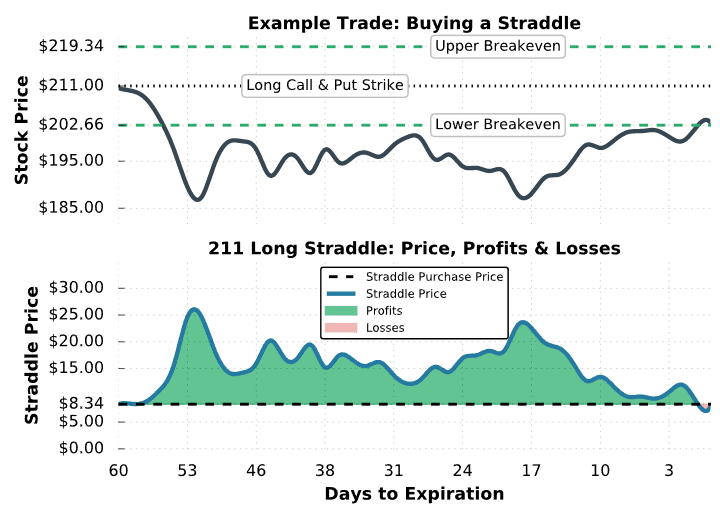
Long Straddle #3 Trade Results
As we can see here, the stock price fell significantly after the long straddle was entered. As a result, the position had profits over the entire period. At the highest point, the profit on the long straddle was approximately $1,700: ($25 straddle price – $8.34 purchase price) x 100 = +$1,666.
However, the stock price rallied back to the long straddle’s lower breakeven and the trade had a small loss at expiration. The only way the trader could have secured the profits on the position would have been to sell the straddle while it was profitable.
At expiration, since the long 211 put was in-the-money, the trader would end up with -100 shares of stock if the put was held through expiration. If the trader wanted to avoid a stock position, the long 211 put would need to be sold before it expired.
Final Word
Congratulations! You should now be much more confident with how the long straddle works as a trading strategy!
Let’s review what we have learned:
- The long straddle consists of purchasing one put and one call option, usually at-the-money.
- Since we are buying options, the most we can ever lose is the total debit paid.
- The max profit in a long straddle is unlimited; the call has no cap.
- The delta of straddles change quickly with fluctuations in the market.
projectfinance Options Tutorials

About the Author
Chris Butler received his Bachelor’s degree in Finance from DePaul University and has nine years of experience in the financial markets.
Chris started the projectfinance YouTube channel in 2016, which has accumulated over 25 million views from investors globally.