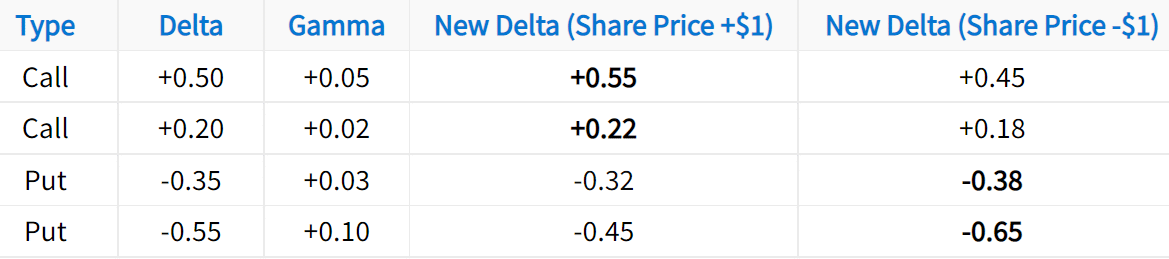
In this example, the bolded numbers represent a growth in the option’s directional exposure. Additionally, this table demonstrates how gamma can be applied:
1) To estimate an option’s new delta after a $1 increase in the share price, add the option’s gamma to its delta.
2) To estimate an option’s new delta after a $1 decrease in the share price, subtract the option’s gamma from its delta.
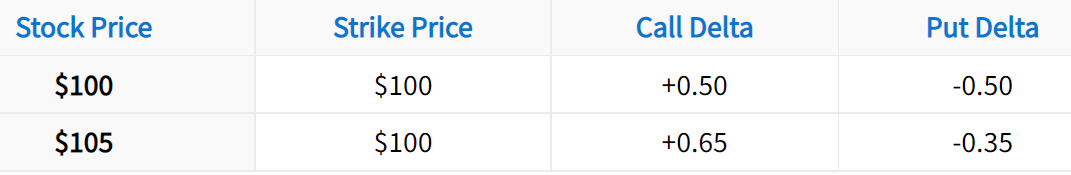
Recall that call deltas range from 0 to +1, and put deltas range from -1 to 0. This brings us to two key concepts:
1) When the share price increases, call deltas get closer to +1, and put deltas get closer to 0.
2) When the share price decreases, call deltas get closer to 0, and put deltas get closer to -1.
The image below visualizes these concepts:

Well done! You’ve learned the basics of what an option’s gamma represents. Now, let’s explore more important concepts related to gamma. First, you’ll see some examples of how gamma impacts call and put deltas. Second, you’ll learn which options tend to have the most gamma risk.
(1)")
To build on the previous section, we’re going to visualize option gamma by comparing call and put deltas to changes in the stock price. Let’s dive in!
To visualize the impact of both call and put gamma, we chose a call and put on AAPL with the same strike price and expiration. Here are the specifics:
Stock: Apple Inc. (ticker: AAPL)
Time Period: June 1st, 2015 to August 21st, 2015
Expiration: August 21st, 2015
Call and Put Strike Price: $120
In this visual, be sure to compare the changes in the call and put delta as the stock price changes. In the shaded region, the relationships are the clearest.

As illustrated here, call and put deltas move in the same direction as the stock price. At the beginning of the shaded region, both options were at-the-money and had deltas near ±0.50. As the share price moved higher, the call delta changed to +0.87, while the put delta changed to -0.13.
On the other hand, when the share price collapsed, the call delta fell to +0.25, and the put delta dropped to -0.75. The changes in each option’s delta can be attributed to gamma. To understand why, it helps to think about delta and gamma in terms of probabilities. Next, you’ll learn about how to think about gamma in a probabilistic perspective.
Regarding gamma risk, one of the two factors to consider about an option is whether its strike price is in-the-money (ITM), at-the-money (ATM), or out-of-the-money (OTM). There are two primary reasons for this:
1) In-the-money and out-of-the-money options have the least amount of gamma exposure.
2) At-the-money options have the most gamma exposure.
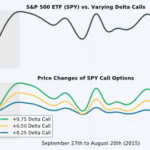
To illustrate this, we’ll look at a snapshot of SPY options from early 2016. In particular, we looked at options with approximately 50 days until expiration. Let’s take a look:

Clearly, options that are in-the-money or out-of-the-money have less gamma exposure than at-the-money options. In this particular example, the at-the-money option gamma suggests that the option deltas will change by ±0.05 with a $1 change in the stock price.
On the other hand, the further the strikes are away from the stock price, the less the option’s gamma exposure. Lower gamma indicates a smaller change in the option’s delta relative to changes in the stock price. Why is this? Well, one explanation is that a $1 change in the stock price doesn’t significantly lower the chances of deep-in-the-money or out-of-the-money options expiring in-the-money.
Next, we’ll explore the gamma of options with different lengths of time until expiration.
The second most important factor that influences an option’s gamma is the amount of time left until the option expires. To analyze this, we averaged the gamma of calls and puts at each strike in SPY. Additionally, we investigated options with 14, 42, 77, and 197 days until expiration. Let’s look at the results!

As illustrated here, at-the-money options with little time until expiration have the most gamma exposure. Conversely, in-the-money and out-of-the-money options with fewer days until expiration have less gamma exposure.
Why is this? Well, as discussed earlier, gamma can be thought of as the change in an option’s probability of expiring in-the-money. When the stock price moves up or down by $1, at-the-money options with little time until expiration will experience the greatest change in the probability of expiring in-the-money (delta), since there’s less time for the option to become in-the-money again.
In regards to in-the-money and out-of-the-money options, the same concept can be applied. With such little time to expiration, in-the-money and out-of-the-money option gamma is less significant because a $1 shift in the underlying price doesn’t have a large impact on the probability of an option expiring in-the-money (delta).
For example, consider a stock that’s trading for $200. If there’s one day left until expiration, a 210 call’s delta will be close to zero because it’s almost certain to expire out-of-the-money. Now, if the stock price rises to $201, the 210 call’s delta will still be close to zero because there’s not much time left for the stock to increase the additional $9+ required for the 210 call to be in-the-money.
Hopefully this helps you understand in-the-money, at-the-money, and out-of-the-money option gamma over various time frames. We’ll be discussing these concepts further in the next examples.
Next, we’ll take a look at a visual example of at-the-money option gamma expansion as expiration approaches.
As expiration approaches, at-the-money option gamma should increase significantly because smaller changes in the stock price have a larger impact the option’s probability of expiring in-the-money. Let’s visualize what this looks like with real data! Here is the setup:
Stock: Netflix (ticker symbol: NFLX)
Time Period: November 16th to December 18th (2015)
Expiration / Time to Expiration: December 18th, 2015 / 32 Days to Expiration
Put Strike Price: $120
Let’s take a look at what happens to the option’s delta and gamma as expiration approaches:

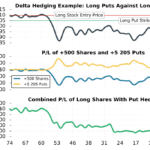
Early on in the period, NFLX increased from $110 to $130, which resulted in the put’s delta changing from -0.70 to -.20. In the final days of the period, NFLX decreased from $124 to $117, which resulted in the put’s delta changing from -0.25 to -1.00.
Even more specifically, early on in the trade, a $20 increase in the stock price caused the option’s delta to change by 0.50. However, when the option was closer to expiration, a $7 decrease in the stock price caused a 0.75 change in the option’s delta. In other words, a move one-third of the size resulted in a 50% larger change in the option’s delta. More significant changes in an option’s delta with smaller shifts in the stock price demonstrates the power of at-the-money option gamma near expiration.
Next, we’ll analyze in-the-money and out-of-the-money option gamma over the same time period.
Using the same stock and time period as before, let’s visualize what happens to the delta and gamma of a deep in-the-money put as expiration approaches:

As illustrated here, the put gamma decreased in the last few days before expiration because the option was nearly $20 in-the-money with little time until expiration. As a result, $1 changes in NFLX shares wouldn’t significantly decrease the probability of the option expiring in-the-money.
What about out-of-the-money option gamma? To answer this, we’ll examine the NFLX 135 call over the same period as above. Let’s take a look:

As illustrated here, the out-of-the-money call experienced a decrease in delta and gamma into expiration because the call was nearly $20 away from being in-the-money. As a result, $1 changes in the share price weren’t enough to have an impact on the option’s probability of expiring in-the-money.
To conclude this section, let’s recap what you’ve learned.
First, and most importantly, not all options have equal exposure to gamma. In general, at-the-money options with little time until expiration have the most gamma risk. On the other hand, in-the-money and out-of-the-money option gamma tend to be smaller, especially when the options get closer to expiration.