Last updated on April 4th, 2022 , 05:43 am
▼ The synthetic short stock options strategy consists of simultaneously selling a call option and buying the same number of put options at the same strike price.
Both options must be in the same expiration cycle. As the strategy’s name suggests, a synthetic short stock position replicates shorting 100 shares of stock.
▲ The synthetic long stock position consists of simultaneously buying a call option and selling the same number of put options at the same strike price. Both options must be in the same expiration cycle. As the strategy’s name suggests, a synthetic long stock position replicates buying and holding 100 shares of stock.
By owning a call option and selling a put option at the same strike price, the synthetic long position’s delta exposure will be +100. Compared to buying shares of stock, a trader may be able to enter a synthetic long stock position with a lower margin requirement than buying shares.
Jump To
TAKEAWAYS
- The profit/loss profile of a “synthetic short” mirrors that of short stock and is thus bearish.
- The strategy consists of 1.) short call and 2.) long put.
- Because of the short call, risk on this strategy is unlimited.
- Max profit occurs on the long put side, and happens if the stock goes to zero.
- Because of options leverage, the synthetic short options strategy can be a cheaper alternative than shorting stock.
- The synthetic long stock trade is an advanced options trading strategy.
- The position is created from buying a call option and selling a put option of the same strike.
- The position is suited for very bullish investors who don’t want to pay for the stock.
- Due to the short put, max loss in this strategy is great.
Synthetic Short Stock Strategy Characteristics
Let’s go over the synthetic short stock strategy general characteristics:
➦Max Profit Potential
If the synthetic is entered for a debit: (Strike Price – Debit) x 100
If the synthetic is entered for a credit: (Strike Price + Credit) x 100
➦Max Loss Potential: Unlimited
➦Expiration Breakeven
If the synthetic is entered for a debit: Strike Price – Debit Paid
If the synthetic is entered for a credit: Strike Price + Credit Received
To demonstrate these characteristics in action, let’s take a look at a basic example.
Profit/Loss Potential at Expiration
In the following example, we’ll replicate a short share position from the following call and put options:
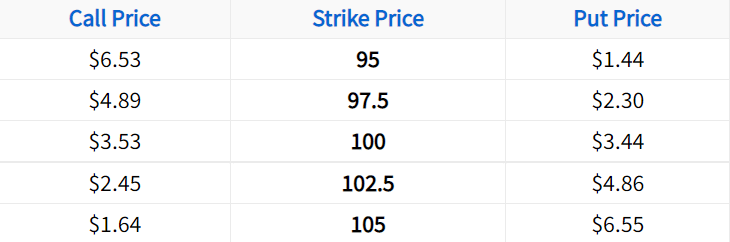
In this example, we’ll simultaneously sell the 100 call and buy the 100 put. When trading synthetic stock positions, you can use any strike price, as long as you purchase the put and sell the call at that strike (in the same expiration cycle).
We choose to use the at-the-money options because they are the most actively traded options, which benefits traders in terms of liquidity.
Lastly, let’s assume the stock price is trading for $100 when entering the position:
Initial Stock Price: $100
Synthetic Short Stock Setup: Short 100 call for $3.53; Long 100 put for $3.44
Credit Received for Synthetic: $3.53 received – $3.44 paid = $0.09
Breakeven Price: $100 strike price + $0.09 credit received = $100.09
As you can see, the position’s breakeven is only $0.09 above the current stock price. The difference is explained by carrying costs that are priced into the options. In this example, the carrying costs stem from the risk-free interest rate, as the stock in this example does not pay any dividends.
The following visual describes the position’s potential profits and losses at expiration:
Synthetic Short Chart
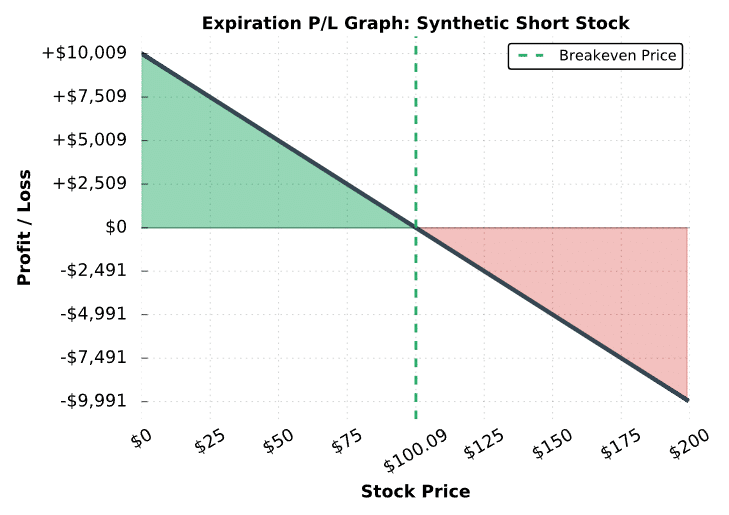
As we can see here, the risk profile of a synthetic short stock position is identical to an actual short stock position. The only difference is the breakeven price, which is miniscule. To be profitable when trading synthetic short stock positions, the stock price must decrease from the point of entry.
Great job! You’ve learned the general characteristics of the synthetic short stock position. Now, let’s go through a real trade example and visualize the performance of the position through time.
(1)")
New to options trading? Learn the essential concepts of options trading with our FREE 160+ page Options Trading for Beginners PDF.
Synthetic Short Stock Trade Example
To bring the previous section to life, we’re going to look at a real synthetic short stock example and visualize the position’s performance over time.
Here are the trade details:
Initial Stock Price: $109.82
Strikes and Expiration: Short 110 call for $4.13; Long 110 put for $4.28; Both options expiring in 45 days
Net Debit: $4.28 in premium paid – $4.13 in premium collected = $0.15 net debit
Breakeven Price: $110 strike price – $0.15 net debit = $109.85
Maximum Profit Potential: $109.85 x 100 = $10,985 (stock price at $0)
Maximum Loss Potential: Unlimited
Let’s see what happens!
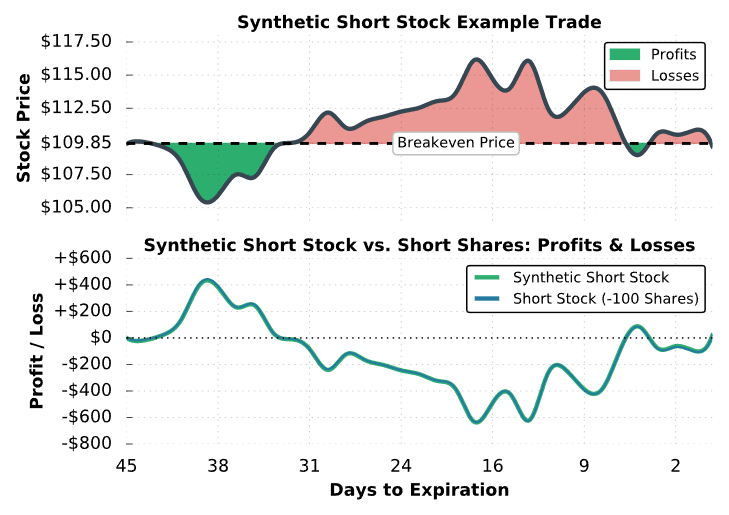
Synthetic Short Trade Results
As you can see, the performance of a short stock position and synthetic short stock position are identical. When the stock price increases from the point of entry, both positions have losses. Conversely, when the stock price falls below the entry price, both positions are profitable.
Now that we’ve learned the synthetic short strategy, let’s move on to the synthetic long options strategy!
Synthetic Long Stock - Strategy Characteristics
Let’s go over the synthetic long stock strategy’s general characteristics:
➦ Max Profit Potential: Unlimited
➦ Max Loss Potential:
If the synthetic is entered for a debit: (Strike Price + Debit) x 100
If the synthetic is entered for a credit: (Strike Price – Credit) x 100
➦ Expiration Breakeven:
If the synthetic is entered for a debit: Strike Price + Debit Paid
If the synthetic is entered for a credit: Strike Price – Credit Received
➦ Estimated Probability of Profit: Approximately 50% because a synthetic long stock replicates owning shares of stock.
To demonstrate these characteristics in action, let’s take a look at a basic example.
Profit/Loss Potential at Expiration
In the following example, we’ll replicate a long share position from the following option chain:
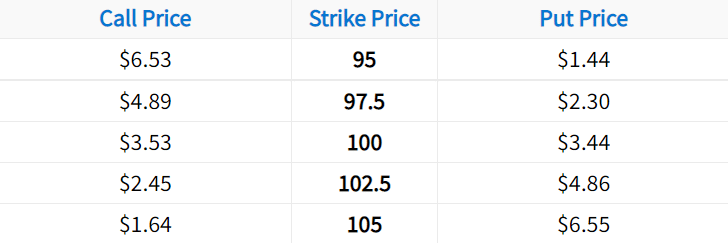
In this example, we’ll simultaneously buy the 100 call and sell the 100 put. When trading synthetic stock positions, you can use any strike price because the breakeven of each position will be the same. We choose to use the at-the-money options because they are the most actively traded options, which benefits traders in terms of liquidity. Lastly, let’s assume the stock price is trading for $100 when entering the position:
Initial Stock Price: $100
Synthetic Long Stock Setup: Long 100 call for $3.53; Short 100 put for $3.44
Debit Paid for Synthetic: $3.53 paid – $3.44 collected = $0.09
Breakeven Price: $100 strike price + $0.09 debit paid = $100.09
As you can see, the position’s breakeven is only $0.09 above the current stock price. The difference is explained by carrying costs that are priced into the options. In this example, the carrying costs stem from the risk-free interest rate, as the stock in this example does not pay any dividends.
The following visual describes the position’s potential profits and losses at expiration:
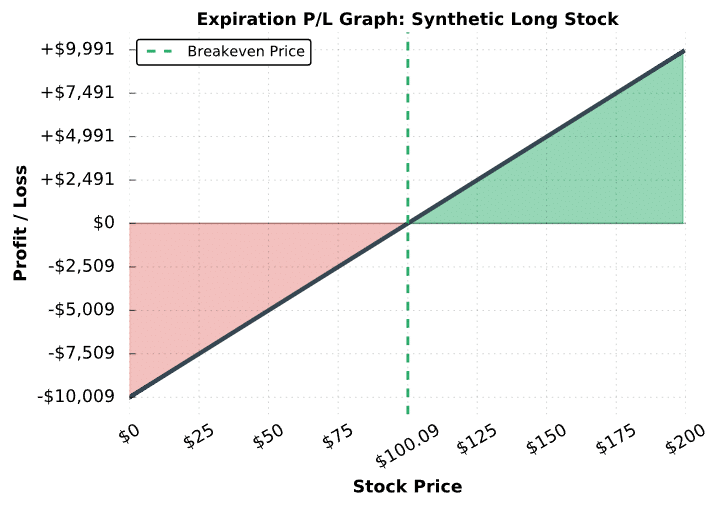
As we can see here, the risk profile of a synthetic long stock position is identical to an actual long stock position. The only difference is the breakeven price, which is miniscule. To be profitable when trading synthetic long stock positions, the stock price must increase from the point of entry.
Nice job! You’ve learned the general characteristics of the synthetic long stock position. Now, let’s go through a real trade example and visualize the performance of the position through time.
Synthetic Long Stock Trade Example
To bring the previous section to life, we’re going to look at a real synthetic long stock example and visualize the position’s performance over time. Here’s the trade setup:
Initial Stock Price: $109.82
Strikes and Expiration: Long 110 call for $4.13; Short 110 put for $4.28; Both options expiring in 45 days
Net Credit: $4.28 in premium collected – $4.13 in premium paid = $0.15 net credit
Breakeven Price: $110 strike price – $0.15 net credit = $109.85
Maximum Profit Potential: Unlimited
Maximum Loss Potential: $109.85 x 100 = $10,985
Let’s see what happens!
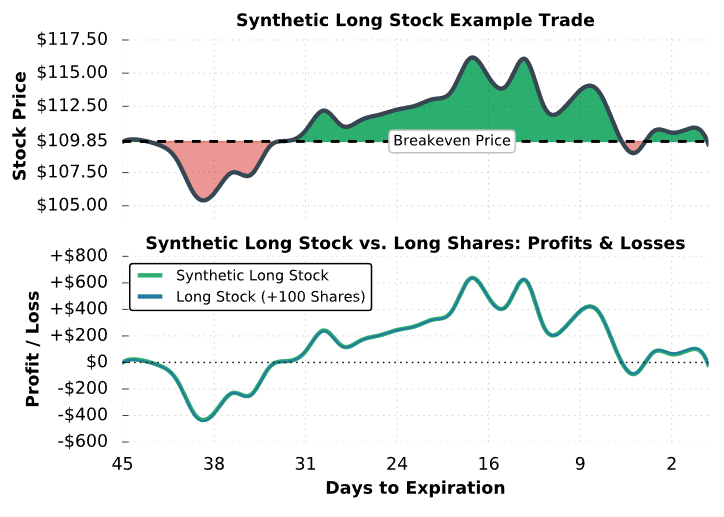
As you can see, the performance of a long stock position and synthetic long stock position are identical. When the stock price increases from the point of entry, both positions are profitable. Conversely, when the stock price falls below the entry price, both positions have losses.
Final Word
Hopefully, this short guide has helped you better understand synthetic options strategies! Let’s review what we have learned:
- The synthetic short stock strategy can be a cheaper alternative to selling a stock.
- Because of the short call, the synthetic short position has infinite risk.
- Be sure to choose liquid options when determining your strike price!
- The synthetic long stock strategy is referred to as “synthetic” because it mirrors a stock position of 100 shares.
- For small accounts wanting upside exposure, synthetic longs are a great alternative to buying more expensive stock.
- Because of the short, unhedged put, max loss is great for synthetic long positions.


projectfinance Options Tutorials

About the Author
Chris Butler received his Bachelor’s degree in Finance from DePaul University and has nine years of experience in the financial markets.
Chris started the projectfinance YouTube channel in 2016, which has accumulated over 25 million views from investors globally.