Last updated on February 10th, 2022 , 01:25 pm
Jump To
A short iron butterfly position can be conceptualized in two ways:
1) Simultaneously selling a straddle and buying a strangle.
2) Simultaneously selling a call spread and put spread with the same short strike price.
The iron fly strategy is very similar to a short straddle, except an iron fly has less risk due to using spreads as opposed to naked short options.
TAKEAWAYS
- The short iron butterfly consists of 4 options: 1 long call, 1 short call; 1 long put, 1 short put.
- In this strategy, all 4 options must be of the same expiration.
- The total credit received is the maximum profit.
- For the short iron butterfly, maximum loss is: (Strike Width of Widest Spread – Net Credit Received) x 10
Short Iron Butterfly General Characteristics
➥Max Profit Potential: Net Credit Received x 100
➥Max Loss Potential: (Strike Width of Widest Spread – Net Credit Received) x 100
➥Expiration Breakevens:
Upper Breakeven = Short Strike + Net Credit Received
Lower Breakeven = Short Strike – Net Credit Received
To demonstrate these characteristics in action, let’s take a look at a basic example and visualize the iron butterfly strategy’s potential profits and losses at expiration.
Short Iron Butterfly Profit/Loss Potential at Expiration
In the following example, we’ll construct a short iron butterfly from the following option chain:
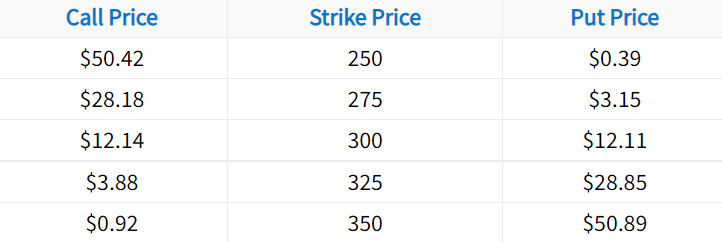
In this case, we’ll sell the 300 call and 300 put for a total credit of $24.25, and we’ll buy the 250 put and 350 call for a total debit of $1.31. Let’s also assume the stock price is trading for $300 when we put this trade on:
Initial Stock Price: $300
Short Strikes: $300 short put, $300 short call
Long Strikes: $250 long put, $350 long call
Credit Received for Short Options: $12.14 + $12.11 = $24.25
Debit Paid for Long Options: $0.39 + $0.92 = $1.31
Total Credit Received: $24.25 Credit – $1.31 Debit = $22.94
The following visual describes the position’s potential profits and losses at expiration:
Iron Butterly Chart
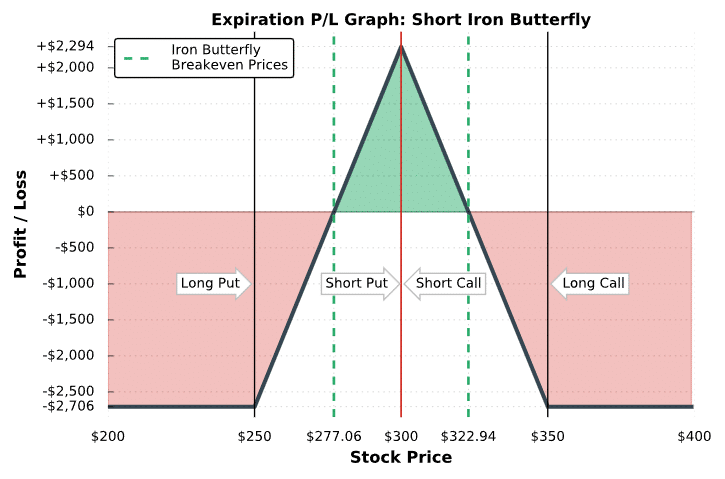
As illustrated above, the short iron butterfly strategy realizes its maximum profit potential when the stock price is trading at the short strike at expiration, which has a low probability of occurring. However, since the short iron butterfly can collect a lot of premium, making partial profits on a short iron butterfly still results in healthy profits compared to making full profit on strategies that collect less premium (such as a short strangle).
Additionally, you’ll notice that a short iron butterfly has a similar risk profile to a short straddle, except the risk of a short iron butterfly is limited beyond the long options.
Regarding loss potential, both the short call spread and put spread are $50 wide. Because of this, the maximum potential loss is: ($50 strike width – $22.94 credit received) x 100 = $2,706. However, if the call spread were $75 wide (e.g. 300 short call and 375 long call), the maximum loss potential of this iron fly would be: ($75 strike width – $22.94 credit received) x 100 = $5,206. So, the loss potential of a short iron fly always depends on the width of the wider spread.
When each spread has the same width, the risk of loss is equal on both sides.
Nice job! You’ve learned the general characteristics of the short iron fly strategy. Now, let’s go through some visual trade examples to solidify your knowledge of how selling an iron butterfly works in practice.
(1)")
New to options trading? Learn the essential concepts of options trading with our FREE 160+ page Options Trading for Beginners PDF.
Short Iron Fly Trade Examples
To visualize the performance of the iron fly strategy relative to the stock price, let’s look at a few examples of some iron butterflies that recently traded. Note that we don’t specify the underlying, since the same concepts apply to short iron flies on any stock. Additionally, each example demonstrates the performance of a single iron fly position. When trading more contracts, the profits and losses in each case will be magnified by the number of iron flies traded.
Let’s do it!
Trade Example #1: Breaking Even
The first example we’ll look at is a scenario where a trader sells an iron fly, but the stock price is near one of the breakeven prices at expiration.
Here are the trade details:
Initial Stock Price: $105.79
Strikes and Expiration: Short 106 Call and Put; Long 97 Put and 112 Call; All options expiring in 45 days
Premium Collected for Short Options: $3.04 for the 106 put + $2.50 for the 106 call = $5.54 in premium collected
Premium Paid for Long Options: $0.77 for the 97 put + $0.35 for the 112 call = $1.12 in premium paid
Net Credit: $5.54 in premium collected – $1.12 in premium paid = $4.42 net credit
Breakeven Prices: $101.58 and $110.42 ($106 – $4.42 and $106 + $4.42)
Maximum Profit Potential: $4.42 net credit x 100 = $442
Maximum Loss Potential (Upside): ($6-wide call spread – $4.42 net credit) x 100 = $158
Maximum Loss Potential (Downside): ($9-wide put spread – $4.42 net credit) x 100 = $458
As mentioned earlier, the maximum loss potential of an iron fly depends on the wider spread. In this example, the short call spread is $6 wide, and the short put spread is $9 wide. Because of this, the maximum loss potential of this iron fly occurs when the stock price collapses through the short put spread. More specifically, this trade has $158 in loss potential on the upside and $458 in potential losses on the downside. Consequently, this particular short iron fly position has a slightly bullish bias because the trader would prefer the stock to rise instead of fall (if the stock was to move in one direction at all).
Let’s see what happens!
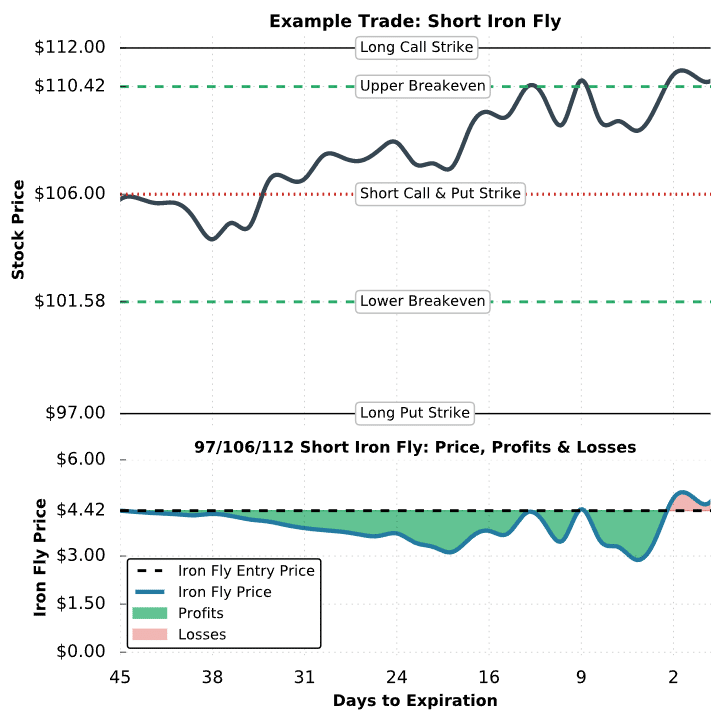
Trade #1 Results
As we can see, this short iron fly was profitable almost the entire period because the stock price was between the breakeven prices. As the days passed, the 106 call and put decayed in price more than the long 97 put and 112 call. Because of this, the position was profitable. However in the final days before expiration, the stock price rallied above the upper breakeven price of $110.42, leading to losses on the position.
More specifically, the stock price was trading for $110.64 at expiration, which means the loss on the iron fly was only $22: ($110.42 upper breakeven – $110.64 final stock price) x 100 = -$22. The strategy is a net loser because the 106 short call expires with $4.64 of intrinsic value when $4.42 was collected for selling the iron fly. Since the position is worth more than it was sold for initially, the trader incurs losses.
In this example, the position was profitable for most of the period, which means the position could have been closed for a profit. If the trader wanted to lock in profits before expiration, an iron fly could be closed by purchasing the short call and put, and selling the long call and put.
Regarding a share assignment, this particular trader would be assigned -100 shares of stock if they did not close the in-the-money short call before expiration. If the trader did not want a short stock position, the short call would need to be bought back before expiration. However, there’s always a chance that the trader could get assigned early on the short call.
Ok, so you’ve seen a short iron fly that breaks even. Next, we’ll take a look at a scenario where a short iron fly realizes the maximum potential loss.
Trade Example #2: Maximum Loss Iron Fly
In the following example, we’ll investigate a situation where the stock price rises continuosly and is above the long call strike price at expiration.
Here are the trade details:
Initial Stock Price: $74.44
Strikes and Expiration: Short 75 Put and Call; Long 70 Put and 80 Call; All options expiring in 39 days
Premium Collected for Short Options: $2.80 for the 75 put + $2.29 for the 75 call = $5.09 in premium collected
Premium Paid for Long Options: $0.95 for the 70 put + $0.67 for the 80 call = $1.62 in premium paid
Net Credit: $5.09 in premium collected – $1.62 in premium paid = $3.47 net credit
Breakeven Prices: $71.53 and $78.47 ($75 – $3.47 and $75 + $3.47)
Maximum Profit Potential: $3.47 net credit x 100 = $347
Maximum Loss Potential: ($5-wide spreads – $3.47 net credit) x 100 = $153
In this example, both the short call spread and short put spread are $5 wide, so the risk is equal on both sides of the trade.
Let’s take a look at what goes wrong:
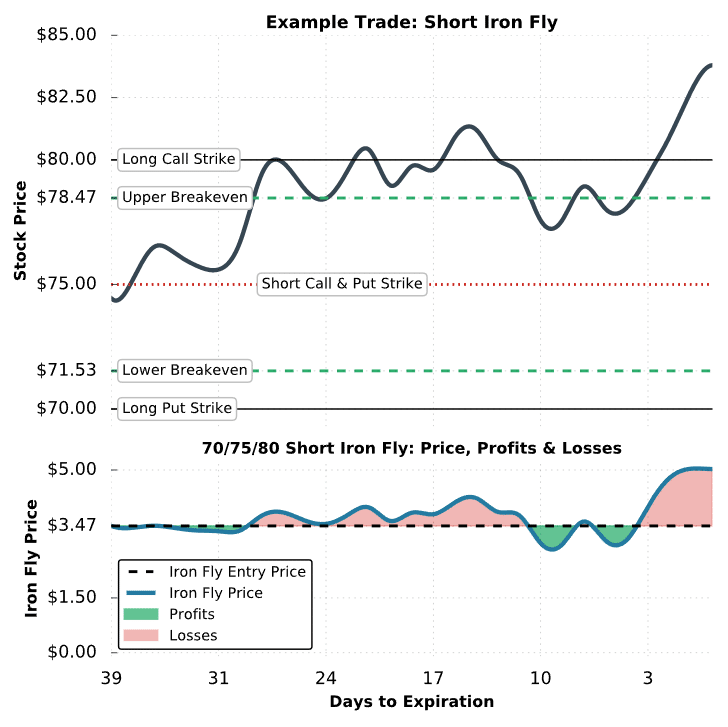
Trade #2 Results
As we can see in this example, the stock price rallied from $74.44 to over $82.50 during the life of this short iron fly position. With an upper breakeven of $78.47, this iron fly suffered losses. However, with a $5-wide short call spread, the maximum value of this iron fly is $5, which caps the iron fly seller’s losses to $153 since the iron fly was sold for $3.47: ($3.47 sale price – $5 expiration value) x 100 = -$153.
At expiration, an in-the-money short call expires to -100 shares of stock and an in-the-money long call expires to +100 shares of stock. Consequently, there is no resulting stock position for the iron fly seller in this example.
Trade Example #3: Highly Profitable Iron Fly
In the final example, we’ll look at a scenario where a short iron fly trader makes almost full profit at expiration. The maximum profit of an iron fly occurs when the stock price is at the short strike at expiration.
Here are the trade details:
Initial Stock Price: $752
Strikes and Expiration: Short 750 put and call; Long 625 Put and 875 Call; All options expiring in 46 days
Premium Collected for Short Options: $36.25 for the 750 put + $37.30 for the 750 call = $73.55 in premium collected
Premium Paid for Long Options: $4.50 for the 625 put + $2.90 for the 875 call = $7.40 in premium paid
Net Credit: $73.55 in premium collected – $7.40 in premium paid = $66.15 net credit
Breakeven Prices: $683.85 and $816.15 ($750 – $66.15 and $750 + $66.15)
Maximum Profit Potential: $66.15 net credit x 100 = $6,615
Maximum Loss Potential: ($125-wide spreads – $66.15 net credit) x 100 = $5,885
In this example, both spreads have equal strike widths, so the risk is the same on both sides. Note that since the maximum profit potential of this trade is greater than the maximum loss potential, this particular iron fly has less than a 50% probability of profit, in theory. Additionally, the at-the-money straddle is trading for $73.55, indicating an “expected move” of around $75, while the iron fly only collects only $66.15. So, if the stock price shifted by the expected move, the position would be a loser because the stock price would be beyond one of the breakeven points.
Let’s see what happens that allows this trade to make money!
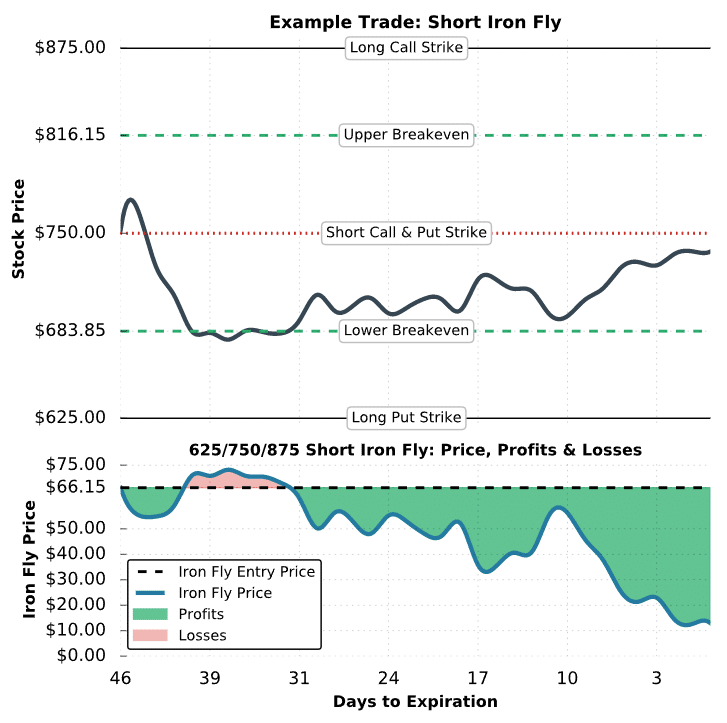
Trade #3 Results
In this example, the short 750 iron fly did quite well because the stock price remained between the breakeven prices for most of the period. Additionally, the stock price was trading for $737.50, just $12.50 below the iron fly’s short strike. Because of this, the 750 put expired with intrinsic value of $12.50 while all of the other options expired worthless. As a result, the net value of the iron fly at expiration is just $12.50. With an initial sale price of $66.15, the profit for the iron fly seller is $5,365: ($66.15 initial sale price – $12.50 expiration value) x 100 = +$5,365.
Regarding a share position, the short iron fly trader would be assigned +100 shares of stock if the short 750 put was held through expiration. Assuming the trader isn’t assigned early on the short put before expiration, the trader could avoid a share assignment by purchasing the short 750 put right before expiration.
Final Word
Congratulations! You should now feel a lot more comfortable with the short iron butterfly strategy! Let’s review what we have learned:
- The short iron butterfly spread is a four-part options trading strategy.
- This strategy performs best in neutral markets.
- Maximum loss is calculated as (Strike Width of Widest Spread – Net Credit Received) x 100
- Maximum profit is always the net credit received.

projectfinance Options Tutorials

About the Author
Chris Butler received his Bachelor’s degree in Finance from DePaul University and has nine years of experience in the financial markets.
Chris started the projectfinance YouTube channel in 2016, which has accumulated over 25 million views from investors globally.
One thought on “Short Iron Butterfly Explained – Examples with Visuals”
Wow! This blog looks just like my old one! It’s on a totally different topic but it has pretty much the same page layout and design. Great choice of colors!