Last updated on April 15th, 2022 , 08:31 am
Jump To
Theta is the option Greek that measures the rate of change in an option’s premium in relation to the passage of time, typically one day.
Why is the passing of time a risk to an option’s trader?
Options are “decaying” assets, which means that option prices decrease over time (all else being equal). An option’s theta estimates how much the price of an option will decrease with the passing of one day.
Since options are decaying assets, theta benefits option sellers. Option buyers, however, require the underlying stock/ETF/index to move by a lot to capture the premium paid for theta.
For this reason, option contract sellers are said to be “positive theta” while option sellers are said to be “negative theta”. The net theta exposure for various options strategies will determine whether a position is positive or negative theta.
To explain why option prices decrease over time, let’s run through a few basic examples.
TAKEAWAYS
- Theta is the option Greek that measures the sensitivity of an option’s price relative to the passage of time. This Greek is important for option traders as it represents the time value decline of options contracts.
- The other four options Greeks are: 1) Vega (implied volatility risk), 2) Delta (underlying stock/ETF/index price movement risk), 3) Gamma (derivative risk derived from delta), and 4.) Rho (interest rate risk).
- Long options are negative theta.
- Short options are positive theta.
- Theta increases as time decay picks up in the weeks leading up to expiration.
Option Decay: A Basic Example
As mentioned above, theta represents how much an option’s price should decrease by with the passing of one day. In the following table, work your way from left to right, and pay attention to how an option’s theta translates to the option’s expected price in the future.
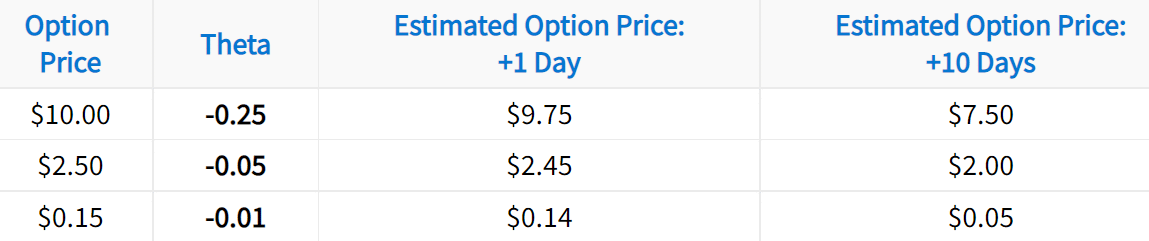
Clearly, options with larger theta values are expected to decay more than options with lower theta values.
Why do option prices decrease over time? To understand why, let’s use a non-options example and bring it full circle.
(1)")
New to options trading? Learn the essential concepts of options trading with our FREE 160+ page Options Trading for Beginners PDF.
Options as Insurance

Consider a 30-day insurance policy that you can buy on your house for $100. 30 days pass, and no damages have occurred to the house. Since the insurance policy’s coverage period has ended, and no damages can be claimed, the insurance policy is worth nothing. This means that in 30 days, the policy’s price decreased from $100 to $0.
Options are essentially insurance contracts that market participants can buy and sell on certain stocks. Consequently, when very little happens to the stock price, options experience the same price decay as the policy in the insurance example.
Theta and Intrinsic/Extrinsic Value
To be clear, only an option’s extrinsic value decays away as time passes. An option’s intrinsic value is the option’s real value at any given moment, and intrinsic value does not decrease with the passing of time.
Let’s look at some real examples so you can see option/theta decay in action.
Theta Decay Example: AAPL Call Options
To demonstrate theta decay, we’ll visualize an option’s price as its expiration approaches. Here are the specifics:
Stock: Apple Inc. (ticker symbol: AAPL)
Option: 105 Call (expired February 2016)
Time Period: January 7th to February 19th (2016)
To clarify, we analyzed the price of the AAPL call option with a strike price of $105, expiring in February of 2016 (standard expiration cycle). Let’s take a look!
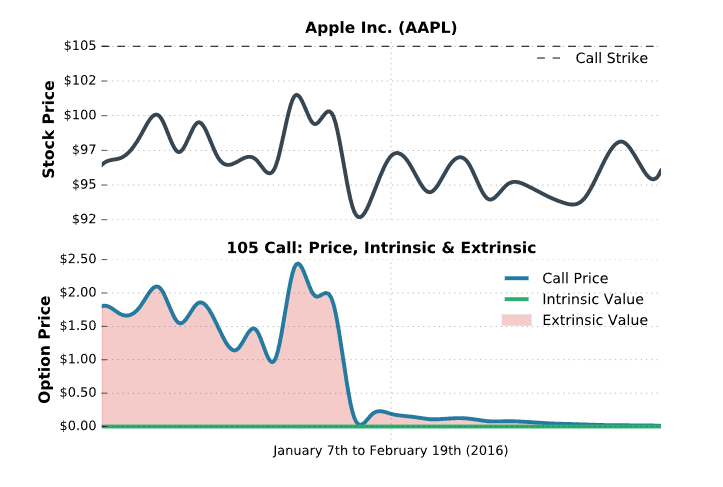
In this visual, you are looking at the price of AAPL (top) compared to the price of the AAPL 105 call expiring in February (bottom). More specifically, the option’s price is dissected into intrinsic and extrinsic value.
In this specific example, the option is out-of-the-money the whole time, which means 100% of the option’s price is extrinsic value. As demonstrated here, the option’s extrinsic value decays away as time passes. At expiration, the option is worth $0. This is theta decay in action (just like the insurance example from earlier).
So, how does theta decay impact an option that has intrinsic value? Let’s take a look at an example!
Decay of an Option With Intrinsic Value
To demonstrate the decay of an option with intrinsic value, we’ll analyze all the same metrics as the previous example. This time, we’ll look at an example with a put option that expires in-the-money. Here are the specifics:
Stock: Tesla Motors (ticker symbol: TSLA)
Option: 230 Put (expired June 2016)
Time Period: April 1st to June 17th (2016)
When looking at this visual, pay attention to the relationship between the option’s price, intrinsic, and extrinsic value as the stock price changes and expiration approaches. Let’s take a look!
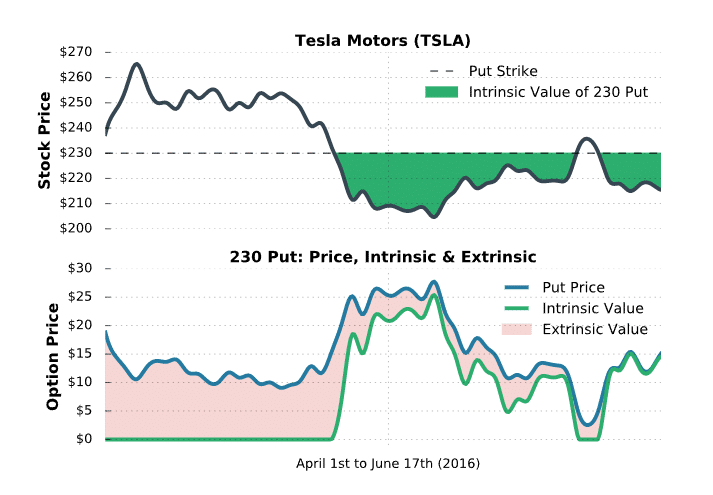
In this example, the 230 put had no intrinsic value initially. Over this period, theta decay kicked in and the option’s price decreased. However, TSLA kept falling, and eventually the option had intrinsic value when TSLA fell below $230.
As expiration approached, all of the extrinsic value decayed out of the option’s price. However, since the option had $15 of intrinsic value at expiration, the option was still worth $15.
So, between the AAPL and TSLA example, you have learned that theta decay only works against an option’s extrinsic value.
Additionally, it’s important to note that time decay generally does not occur exactly like an option’s theta suggests. This is because there are factors other than time that cause option price changes. So, don’t get hung up when theta decay doesn’t work perfectly on a day-to-day basis. Over longer periods of time, it will!
You’ve learned the basics behind the almighty “theta decay.” Now, the next time somebody talks about “decaying assets,” you’ll know what they’re talking about!
Alright, it’s time to dive in a little bit deeper. In the next section, you’re going to learn which options have the most exposure to time decay.
Which Options Have the Most Exposure to Time Decay?
So, you know that options decay, but which options have the most exposure to time decay? The answer to this is very straightforward: options that have the most exposure to decay are the ones with the most extrinsic value. This means at-the-money options in high implied volatility carry the greatest potential losses from theta decay.
The following table demonstrates the expected decay of in-the-money, at-the-money, and out-of-the-money options:
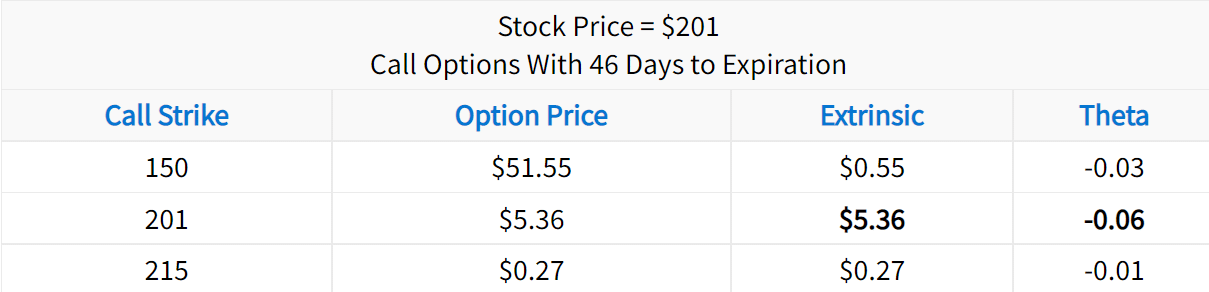
While the 150 call is the most expensive, most of its value is intrinsic, which we know does not decay! On the other hand, the 215 call only has $0.27 of extrinsic value compared to the 201 call. Therefore, at-the-money options have the most to lose from theta decay, since they are the most expensive options that consist of 100% extrinsic value.
To hammer this point home, let’s go through some visualizations to demonstrate which options have the most exposure to decay. First, we’ll analyze an in-the-money call, an at-the-money straddle, and a strangle. Then, we’ll compare options in high and low implied volatility underlyings.
In-the-Money Option Decay Example
The call example we’re going to look at is in NFLX. Here are the specifics:
Stock: Netflix (ticker symbol: NFLX)
Option: 90 Call (April 2015)
Time Period: March 1st to April 15th (2016)
Again, focus on the decay of the call’s extrinsic value. Let’s take a look!
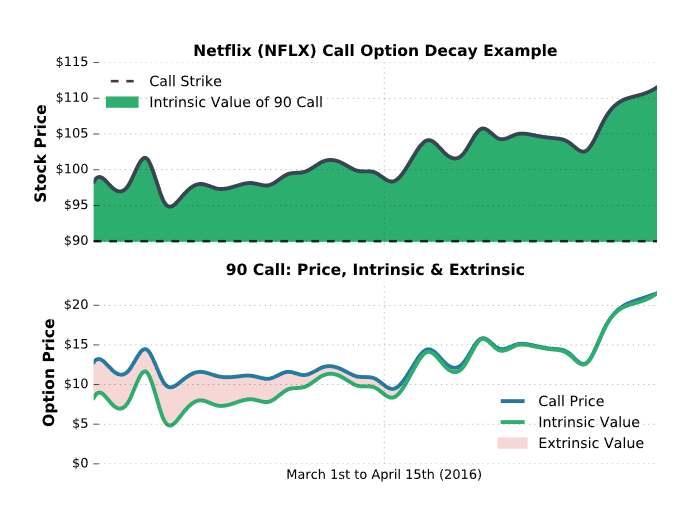
As you can see, the 90 call is in-the-money the whole time as the market price of the underlying steadily rose, which implied the option’s price includes intrinsic value. A trader who owned this call would not have suffered too much from theta decay, as the stock price was moving in their favor and the option’s value was mostly intrinsic.
Now, let’s look at examples of positions that experienced plenty of time decay.
At-the-Money Time Decay Example
As mentioned earlier, at-the-money options have the most exposure to time decay, since their prices are all extrinsic. To illustrate at-the-money decay, we’ll examine a long straddle in Facebook. As a quick recap, a long straddle consists of buying an at-the-money call and put (all extrinsic!). Here are the specifics:
Stock: Facebook (ticker symbol: FB)
Option: 105 Straddle (expired January 2016)
Time Period: November 13th to December 31st (2015)
Let’s take a look at what happened!
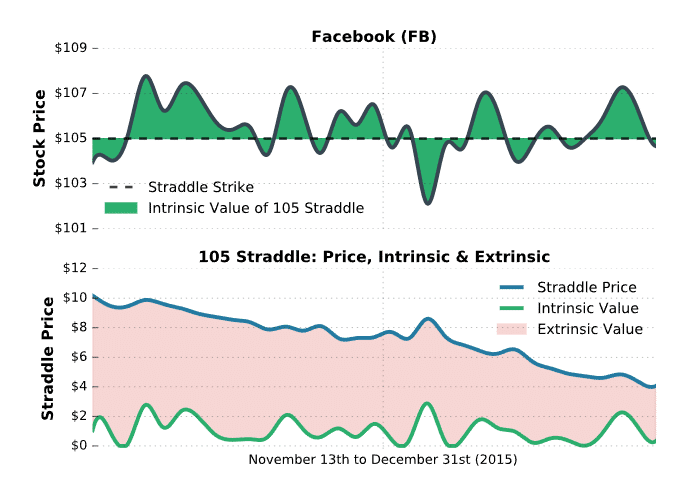
As visualized in this example, the price of the underlying asset (FB) traded near the strike price of the straddle for 33 trading days. As a result, the straddle suffered continuous losses from time decay.
A trader who bought this straddle would have lost $600 per straddle over the period. On the other hand, a trader who sold this straddle would have had $600 in profits from the time decay. As you may have already picked up by now, theta decay is great for options sellers and the primary enemy of option buyers.
Let’s take a look at some out-of-the-money option decay!
Out-of-the-Money Time Decay Example
Lastly, we’re going to look at the decay of out-of-the-money options. Since the previous example in Facebook was such a great time period to demonstrate option decay, we’ll use it again. This time, you’ll get to see the performance of a strangle. Recall that a strangle consists of buying or selling an out-of-the-money call and put. Here are the specifics:
Stock: Facebook (ticker symbol: FB)
Options: 95 Put (expired January 2016), 115 Call (expired January 2016)
Time Period: November 13th to December 31st (2015)
Let’s see what happens!
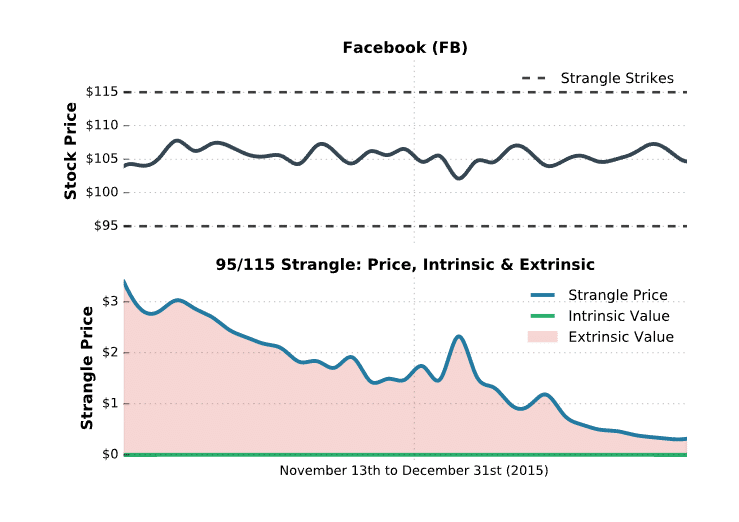
As you can see, the 95 put and 115 call were never in-the-money over the entire period. Consequently, the value of the strangle was 100% extrinsic, and decayed away as time passed. In this example, a hypothetical trader who purchased the strangle suffered continuous losses from time decay.
Conversely, a hypothetical trader who sold the strangle experienced steady profits over the entire trade duration as the price of the underlying stayed steady. This is one demonstration of how traders get into trouble by purchasing out-of-the-money options.
How Option Decay Changes Over Time
In the final sections, we’re going to take your theta/option decay knowledge to the next level by getting a little more specific.
First, we’re going to talk about the difference between in-the-money, at-the-money, and out-of-the-money option decay.
Finally, we’ll end with a very important section that discusses instances in which options don’t decay as expected.
Like most things related to options, nothing is linear due to all of the moving parts. This is also true for an option’s rate of decay. The decay rate of an option may speed up or slow down as time passes. This depends on whether the option is in-the-money, at-the-money, or out-of-the-money.
In general, as expiration gets closer:
➜ At-the-money option decay tends to speed up significantly.
➜ Out-of-the-money option decay tends to slow down.
Acceleration of At-the-Money Time Decay
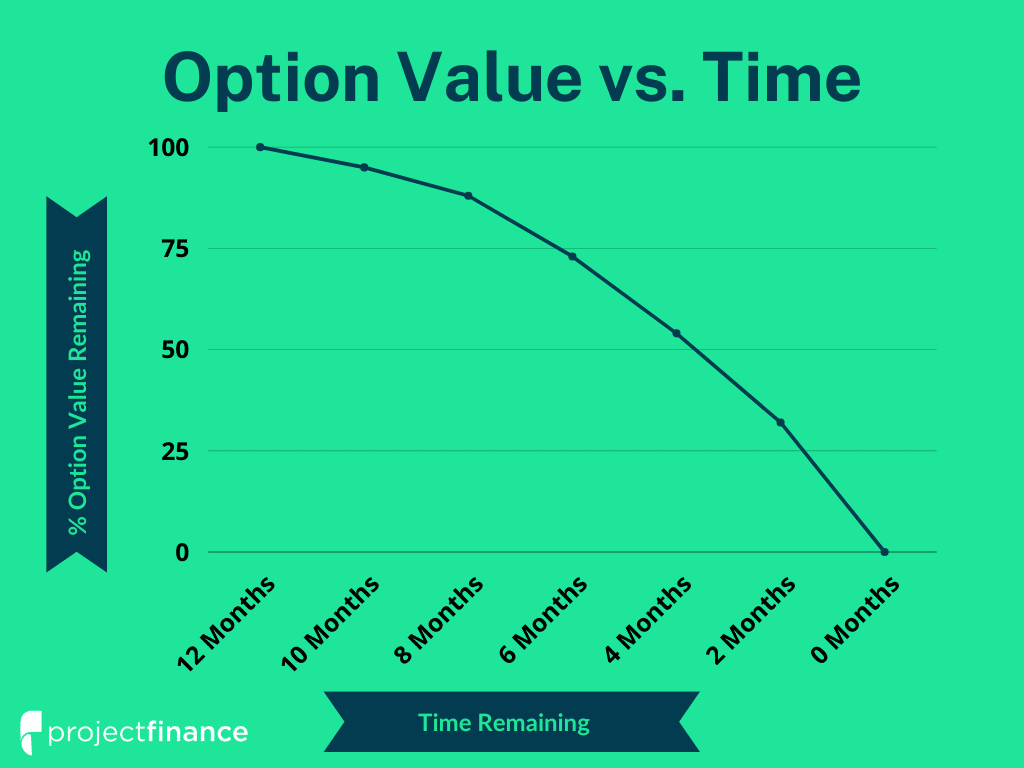
Let’s start with at-the-money time decay. To visualize at-the-money option decay into expiration, we ran a test. From January of 2007 to the end of 2016, we did the following:
➜ On the first trading day of each month, we selected the expiration cycle closest to 75 days away.
➜ Each subsequent trading day, we recorded the at-the-money straddle price in that expiration cycle. For example, if the stock was $200, we recorded the 200 straddle price. On the following day, if the stock was $190, we recorded the 190 straddle price in that same expiration cycle. This process was repeated until each respective expiration date was reached.
Overall, 118 expiration cycles were tested.
Once all of the prices were collected, we computed the percentage of each day’s straddle price relative to the starting straddle price. For example, if the at-the-money straddle was $10 on the first day (75 days to expiration), and 30 days later the at-the-money straddle price was $7, then the remaining extrinsic at 45 days to expiration would be considered 70%.
Lastly, we averaged the remaining extrinsic percentages across all 118 occurrences based on the number of days until expiration. Let’s take a look!
ATM = At-the-money
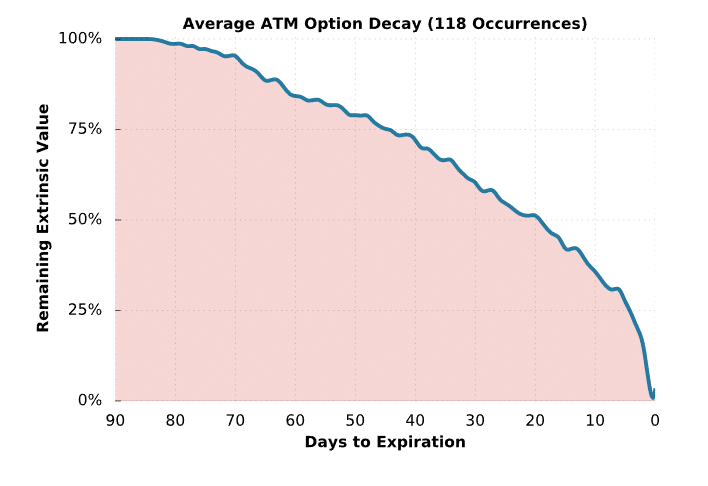
As illustrated here, the decay of at-the-money option prices accelerates as expiration gets closer and closer. More specifically, the rate of at-the-money decay was fairly slow from 75 to 60 days to expiration.
From 60 to 30 days to expiration, the rate of decay began to accelerate.
In the final 30 days, the rate of decay really picks up speed, with the steepest decay occurring in the final 5-7 days. Even more interesting, after 85 of the 90 days, the straddle still held on to 25% of its value, on average.
Deceleration of Out-of-the-Money Option Decay
As mentioned earlier, out-of-the-money options decay slower and slower as expiration approaches. Why is this? Near expiration, out-of-the-money options will be nearly worthless, which means the option doesn’t have much to lose in the first place.
To demonstrate the slowing decay of out-of-the-money options, we used a similar approach to the at-the-money decay study. Again, we used SPY options from January 2008 to April 2016, reaching 100 occurrences. Here’s what we did:
➜ On the first trading day of each month, we selected the expiration cycle that was closest to 75 days away.
➜ On that first day, we selected the 10-delta call and put strikes (10% probability of expiring in-the-money, which means they were far away from the stock price). Then, we recorded how many points the call and put strikes were from the stock price.
➜ Each subsequent day, we recorded the combined price of the call and put options that were the same distance away from the stock price as the initial call and put. This process was repeated until each respective expiration was reached.
Like the previous study, we tracked the “remaining extrinsic value” on each day, which is the combined price of the call and put relative to the initial price of the call and put. Finally, we averaged the remaining extrinsic across all of the occurrences based on the number of days until expiration.
OTM = Out-of-the-Money
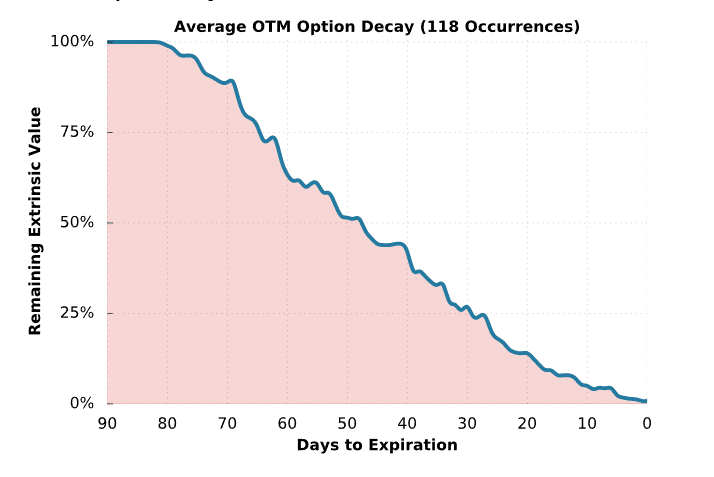
Note: The non-existent decay at the beginning of the curve is due to the fact that the longest-duration option tested had around 80 days to expiration.
As you can see here, the decay curve is almost the opposite of the at-the-money decay curve in the previous example. In this case, the out-of-the-money theta decay slowed down in the final 30 days. More specifically, the decay from 50% to 25% took about 20 days, while the decay from 25% to 0% took about 30 days, on average.
From this specific dataset, the steepest decay for far out-of-the-money options occurred from 75 to 50 days to expiration.
Great job! You should now have a much deeper understanding of option theta, and the factors that contribute to the level of an option’s decay.
Option Theta FAQs
Since theta measures the rate at which an option decays, low theta is good for long options. High theta, on the other hand, is good for short options.
Theta measures the rate at which an option declines in value on a daily basis. Traders short options profit from their positive theta with every passing day, assuming stock price and implied volatility remain the same.
In options trading, the Greek theta tells us how much an option will decline in value with every passing day in a constant market. In a steady market, theta works in the favor short option sellers and against long option buyers.
Options decay every moment of every day. As long as the clock is ticking, options shed value. Theta even applies to days when the market is not open.
projectfinance Options Tutorials
Additional Resources

About the Author
Chris Butler received his Bachelor’s degree in Finance from DePaul University and has nine years of experience in the financial markets.
Chris started the projectfinance YouTube channel in 2016, which has accumulated over 25 million views from investors globally.
2 thoughts on “Option Theta (Time Decay) | The Ultimate Guide w/ Visuals”
I’ve learn a few just right stuff here. Definitely value bookmarking
for revisiting. I surprise how so much effort you put to create one
of these wonderful informative web site.
Thanks so much for the comment! I’m glad it helped!