Volatility Skew in Options Trading (Guide w/ Visuals)

A stock’s implied volatility represents the overall level of a stock’s option prices. However, each individual option trades with its own implied volatility. By analyzing the prices (implied volatility) of options at various strike prices, we can learn if a particular stock trades with volatility skew, as well as other useful bits of information from that skew.

What is Volatility Skew?

Volatility skew refers to the inequality of the implied volatility of out-of-the-money calls and puts (you can look at in-the-money options, too, but in this post, we’ll keep things simple and focus on out-of-the-money options). For example, on most equities, the volatility skew lies with out-of-the-money puts. That is, the implied volatilities of out-of-the-money puts exceed the implied volatilities of out-of-the-money calls at similar distances from the current stock price.

Jump To

Options Trading for Beginners(2)(1)

New to options trading? Learn the essential concepts of options trading with our FREE 160+ page Options Trading for Beginners PDF.

Downside Volatility Skew

To illustrate downside volatility skew, let’s take a look at an example in the S&P 500 Index (SPX):

As we can see, the at-the-money put (2,310) is trading at a premium to the at-the-money call (2,310), and has an implied volatility 1.5% greater than the call. If we look at the put that’s 100 points lower than SPX, we see that the 2,210 put is trading for $7.75 (an implied volatility of 13.7%). On the other hand, if we look at the call that’s 100 points above SPX, we see that the 2,410 call is trading for $1.25 (an implied volatility of 8.2%).

So, since the out-of-the-money put is trading at a higher price (and therefore implied volatility) than the out-of-the-money call that’s the same distance away from SPX, we learn that SPX has downside volatility skew. 

What Causes Downside Volatility Skew?

In most equities, downside volatility skew is present. Why? Well, most people own stocks in their investment portfolios. There are two very simple and common ways to use options in a long stock portfolio:

1. Purchase out-of-the-money puts to hedge off the risk of a decrease in the stock price (a protective put)

2. Sell out-of-the-money calls to create a potential stream of income on shares of stock without adding any risk (a covered call position).

These two activities cause natural buying pressure in put options and selling pressure in call options, which results in more expensive puts and cheaper calls. Of course, not all of the skew comes from long stock investors, there are speculators as well. The bottom line is that in most equities, the risk is perceived to the downside, not the upside. So, you’ll typically observe downside volatility skew in equities.

Upside Volatility Skew

On the other side of the spectrum, we have upside volatility skew, where out-of-the-money call options are more expensive (higher implied volatility) than out-of-the-money puts.

Which products tend to have upside volatility skew? The most obvious products that come to mind are volatility-related underlyings, such as VIX options, VXX, and UVXY. Why? These products have the potential to explode when the stock market falls, which means purchasing call options in these products is similar to buying puts in equities.

As an example, let’s take a look at options in VXX (the Short-Term VIX Futures ETN), a product that attempts to track the performance of S&P 500 implied volatility:

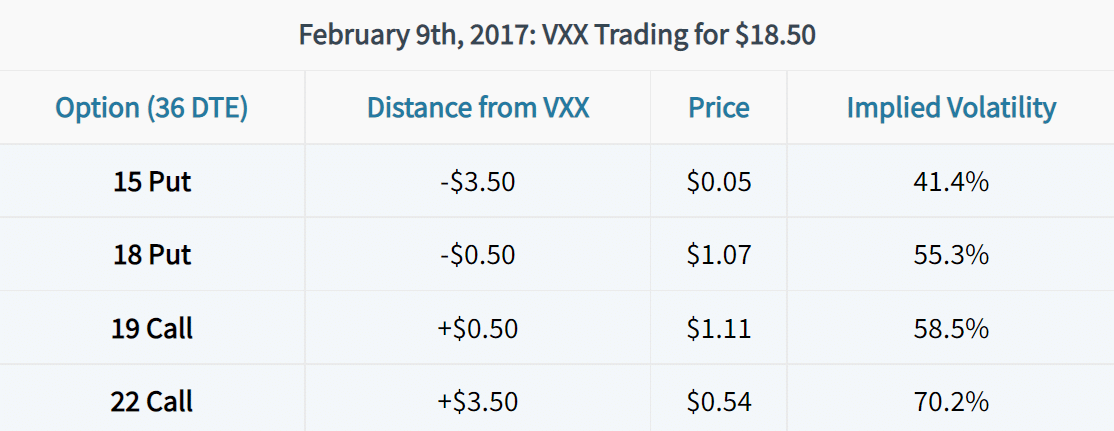
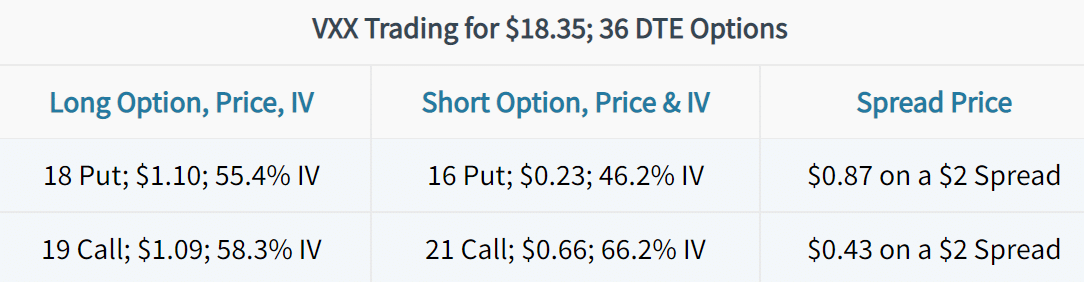
In this case, we can see that the price and implied volatility of the out-of-the-money put (15) are far less than the price and implied volatility of the out-of-the-money call (22) that’s the same distance from the current price of VXX. As a result, the volatility skew in VXX is to the upside.

What Does Volatility Skew Tell You?

There are three useful pieces of information that one can glean from an underlying’s volatility skew:

1. The direction in which the risk is perceived to be in the underlying.

2. How implied volatility will change relative to movements in the underlying.

3. The prices of call spreads and put spreads on that underlying.

#1: An Underlying’s Perceived Risk

As discussed earlier, a downside volatility skew indicates that the market is pricing in more risk for decreases in the underlying than increases in the underlying. On the other hand, upside volatility skew indicates more risk being priced into increases in the underlying than decreases in the underlying.

#2: How Implied Volatility Will Change Relative to Underlying Movements

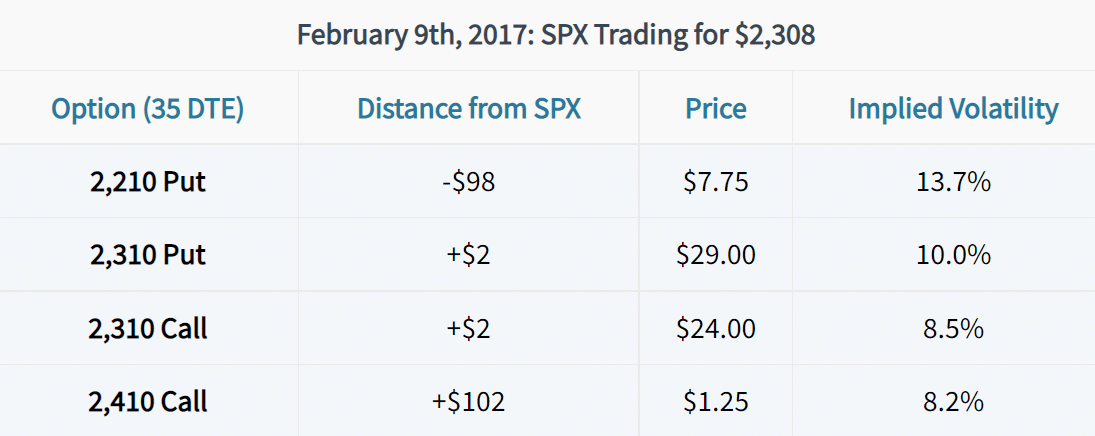
In stocks with downside volatility skew, the implied volatility of the underlying will typically increase if the stock price falls. As an example, let’s look at the relationship between the S&P 500 Index and the VIX Index:

Volatility Skew and Volatility Path: SPX Index vs. VIX Index

The VIX Index quantifies the prices (implied volatility) of near-term options on the S&P 500 Index (SPX). As shown earlier, SPX typically has downside volatility skew. In the chart above, we can see that when SPX falls, SPX implied volatility (the VIX) tends to increase.

What about on an underlying with upside volatility skew? To illustrate changes in implied volatility on an underlying with upside volatility skew, let’s examine the relationship between changes in the VIX Index and the implied volatility of VIX options (quantified by VVIX):

Volatility Skew and Volatility Path: VIX vs. VVIX

As we can see here, as the VIX Index increase, so do the implied volatilities of VIX options (VVIX).

So, volatility skew can tell you how the implied volatility of the underlying’s options are expected to change relative to changes in the underlying price.

Why does this matter? Well, if you’re trading positive delta, positive vega strategies on a product with upside volatility skew, you’ll know that an increase in the underlying should lead to profits from changes in direction and volatility.

On the other hand, if you’re trading negative delta, negative vega strategies on a product with downside volatility skew, and that underlying falls in price, you can expect some of your directional profits to be offset by an increase in volatility.

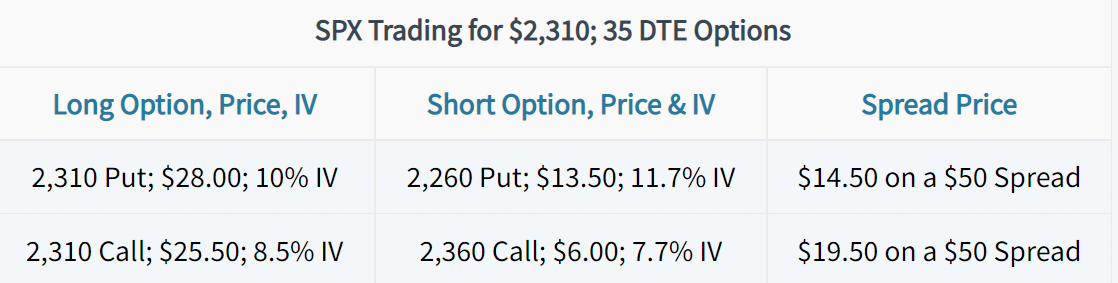
#3: The Prices of Call Spreads and Put Spreads

The third helpful piece of information that the skew of an underlying’s option volatility can tell you is the price of call and put spreads (in a broad sense):

➥In products with upside volatility skew, call spreads trade cheap and put spreads trade expensive.
 
➥In products with downside volatility skew, put spreads trade cheap and call spreads trade expensive.

Let’s take a look at some examples:

As we know, SPX volatility is skewed to the downside. If we were to buy the put spread in this example, we’d be buying a put with 10% IV and selling a put with 11.7% IV. The higher IV we’re selling helps reduce the cost of the spread price.

If we look at the call spread from the long side, we’re buying an 8.5% IV option and selling a 7.7% IV option. Since we’re selling an option with a lower IV than the option we’re buying, the spread’s price is more expensive.

In both cases, the spreads are $50 wide and the long options are at-the-money. However, the downside skew results in a cheaper put spread and a more expensive call spread. Consequently, put spread buyers and call spread sellers benefit, while put spread sellers and call spread buyers have less advantageous risk/reward setups.

Now, let’s look at the prices of spreads on an underlying with volatility skewed to the upside. In this example, we’ll use VXX:

In the case of these VXX spreads, we can see that the 18/16 put spread is trading for $0.87, while the 19/21 call spread is trading for $0.43. This can be explained by the fact that we’re buying a 55.4% IV put, while selling a 46.2% IV put, resulting in an expensive spread.

On the other hand, the call spread is much cheaper since we’re buying a 58.3% IV option and selling a 66.2% IV option. Now, while VXX is slightly closer to the put spread, we’d still see the same result if VXX were $18.50 (right in the middle of both spreads).

So, in underlyings with upside volatility skew, call spreads will trade cheaper and put spreads will trade more expensive, which is beneficial for call spread buyers and put spread sellers. In the case of call spread sellers and put spread buyers, the risk/reward will be less favorable.

Summary

Well, that wraps up the post on volatility and skew! I hope you’ve learned something that can help you in your trading.

To summarize what this post has covered, here are the key points to remember:

  • Individual options trade with their own levels of implied volatility based on their respective prices.
  • In products where out-of-the-money puts are more expensive than out-of-the-money calls, volatility is said to be skewed to the downside.
  • In products where out-of-the-money calls are more expensive than out-of-the-money puts, volatility is skewed to the upside.
  • An underlying’s volatility skew can provide you with three helpful pieces of information: 1. Where the risk is perceived to be 2. How implied volatility is likely to change relative to the underlying’s movements 3. Which spreads will be more expensive, and which will be cheaper.
Chris Butler portrait

About the Author

Chris Butler received his Bachelor’s degree in Finance from DePaul University and has nine years of experience in the financial markets. 

Chris started the projectfinance YouTube channel in 2016, which has accumulated over 25 million views from investors globally.

Our Authors

Share this post

Leave a Reply

Your email address will not be published.